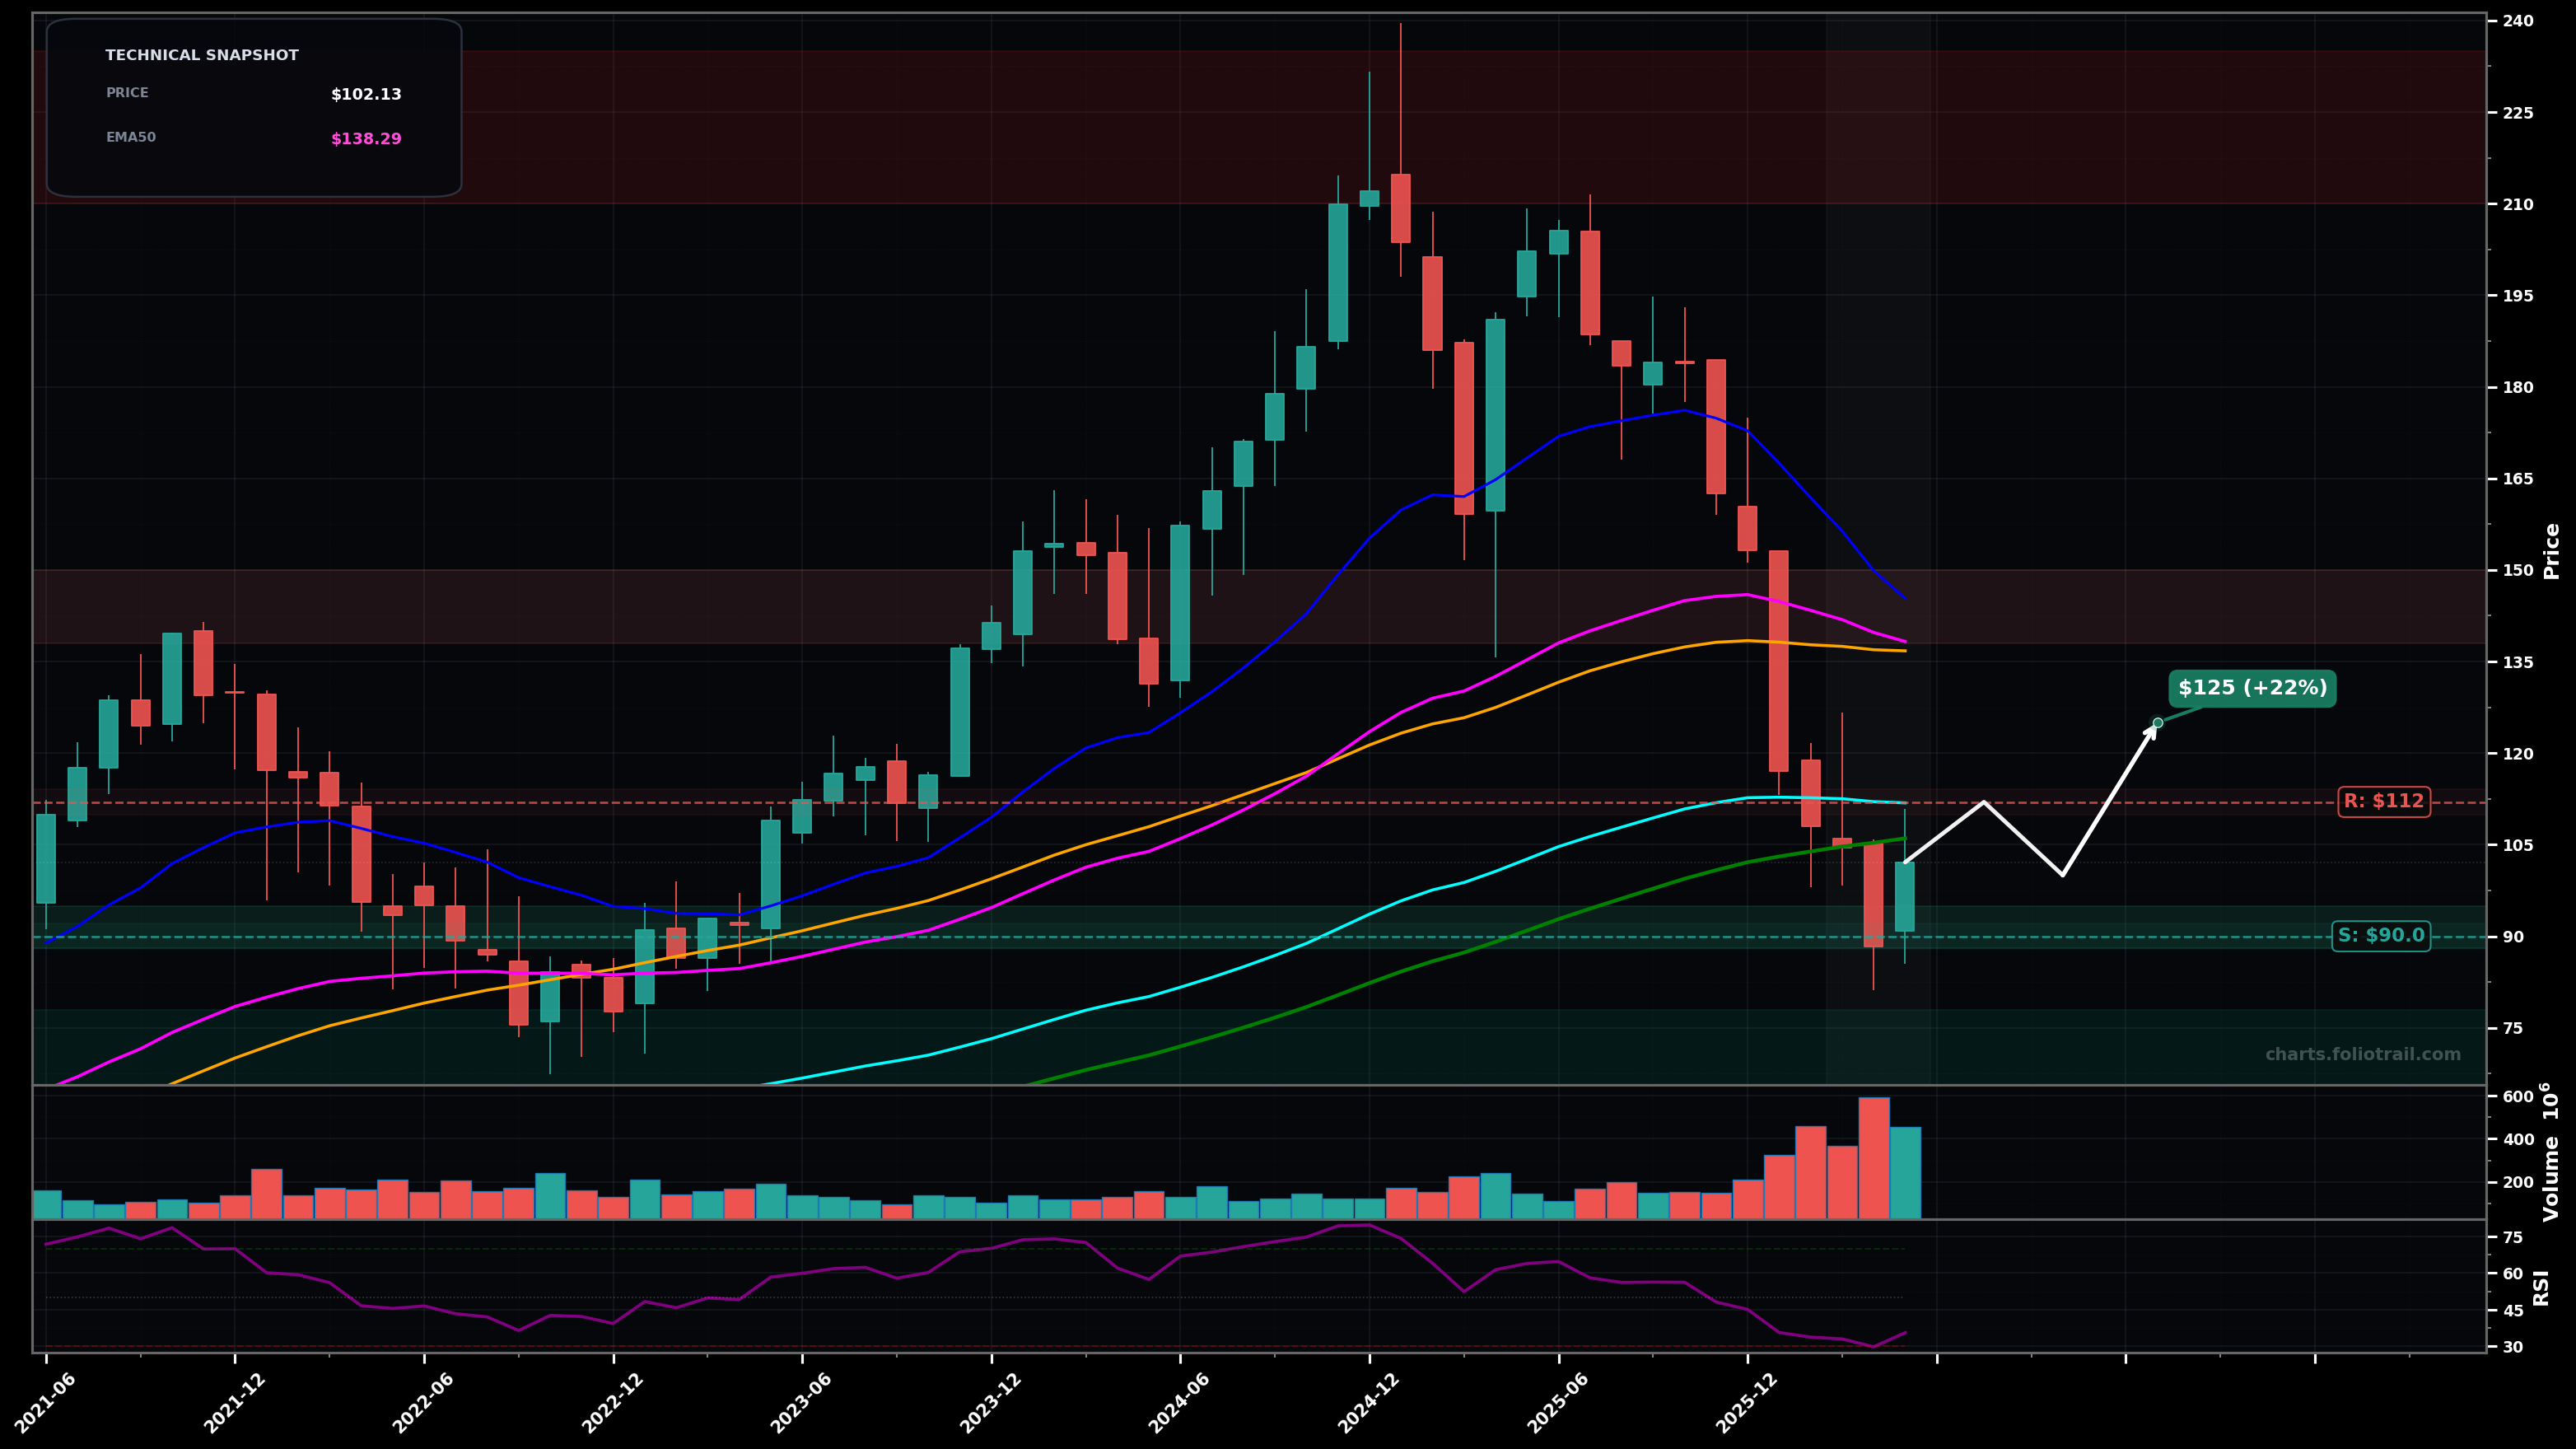
As of May 22, 2026, NOW (ServiceNow, Inc.) is in a falling knife state on the monthly chart, with a confidence level of 74%. Key support is at $90.0 and key resistance at $112. Sharp selloff from the $180-$210 area into ~$90, then a bounce back to ~$102; price remains below EMA50/EMA100 and below most key MAs while volume expanded on the dump; RSI-14 ~35 (weak/near-oversold).
Dead-cat bounce / basing attempt: hold the ~$90 swing-low zone, grind higher toward the EMA100 (~$112) and possibly tag the breakdown area around $120-$125 before sellers reappear (typical wave-4 style retrace after an impulsive drop).
Continuation selloff: failure to reclaim $112 and loss of ~$90 triggers another leg down (Elliott: extended wave-5 / capitulation tail risk), aiming for a deeper Fibonacci retrace of the prior 2023-2024 advance.
Monthly close back below $95 would confirm continued falling-knife pressure
2 consecutive monthly closes above $112 (EMA100) would invalidate the falling-knife call (shift to bottoming/reversal risk)
Scale into the swing-low support (~$90) first; add on breakdown/retest; heavy add only at deeper capitulation where reward/risk improves (below support + likely fib confluence).
Trim into reclaimed EMA50/overhead supply ($138-$150); heavier trims into prior distribution zone ($175-$195); fully close into prior blow-off top area ($210+).
As of May 22, 2026, NOW (ServiceNow, Inc.) is in a falling knife state on the monthly chart with 74% confidence. Sharp selloff from the $180-$210 area into ~$90, then a bounce back to ~$102; price remains below EMA50/EMA100 and below most key MAs while volume expanded on the dump; RSI-14 ~35 (weak/near-oversold).
On the monthly timeframe, NOW has key support at $90.0 and key resistance at $112. The most likely scenario (bullish) targets $112 and $125, with a revert level at $100.
NOW (ServiceNow, Inc.) is currently classified as falling knife on the monthly chart, with 74% confidence. Confirmation requires: Monthly close back below $95 would confirm continued falling-knife pressure This would be invalidated by: 2 consecutive monthly closes above $112 (EMA100) would invalidate the falling-knife call (shift to bottoming/reversal risk)
The most likely scenario (bullish) targets $112 and $125, with a revert level at $100. The alternative scenario (bearish) targets $90.0 and $75.0.
Multi-layer AI agents analyse 200+ stocks across daily, weekly, and monthly timeframes — producing market state classifications, price scenarios with targets, and position entry/exit levels. Daily charts updated every trading day at 6 PM ET. Weekly charts refresh Fridays. Monthly charts refresh on the last trading day of each month. No paywall. No sign-up required.
Built by Foliotrail.
All content on this website — including charts, analysis, price targets, support/resistance levels, and position zones — is generated entirely by AI and provided for educational and informational purposes only.
This is not financial advice. NEXUSNOIR VENTURES SL (the operator of this website) is not a registered investment adviser or broker-dealer. You should not make investment decisions based solely on this information. Always do your own research and consult a qualified financial advisor.
By continuing, you acknowledge that you have read and agree to our full disclaimer & terms of use and privacy policy.