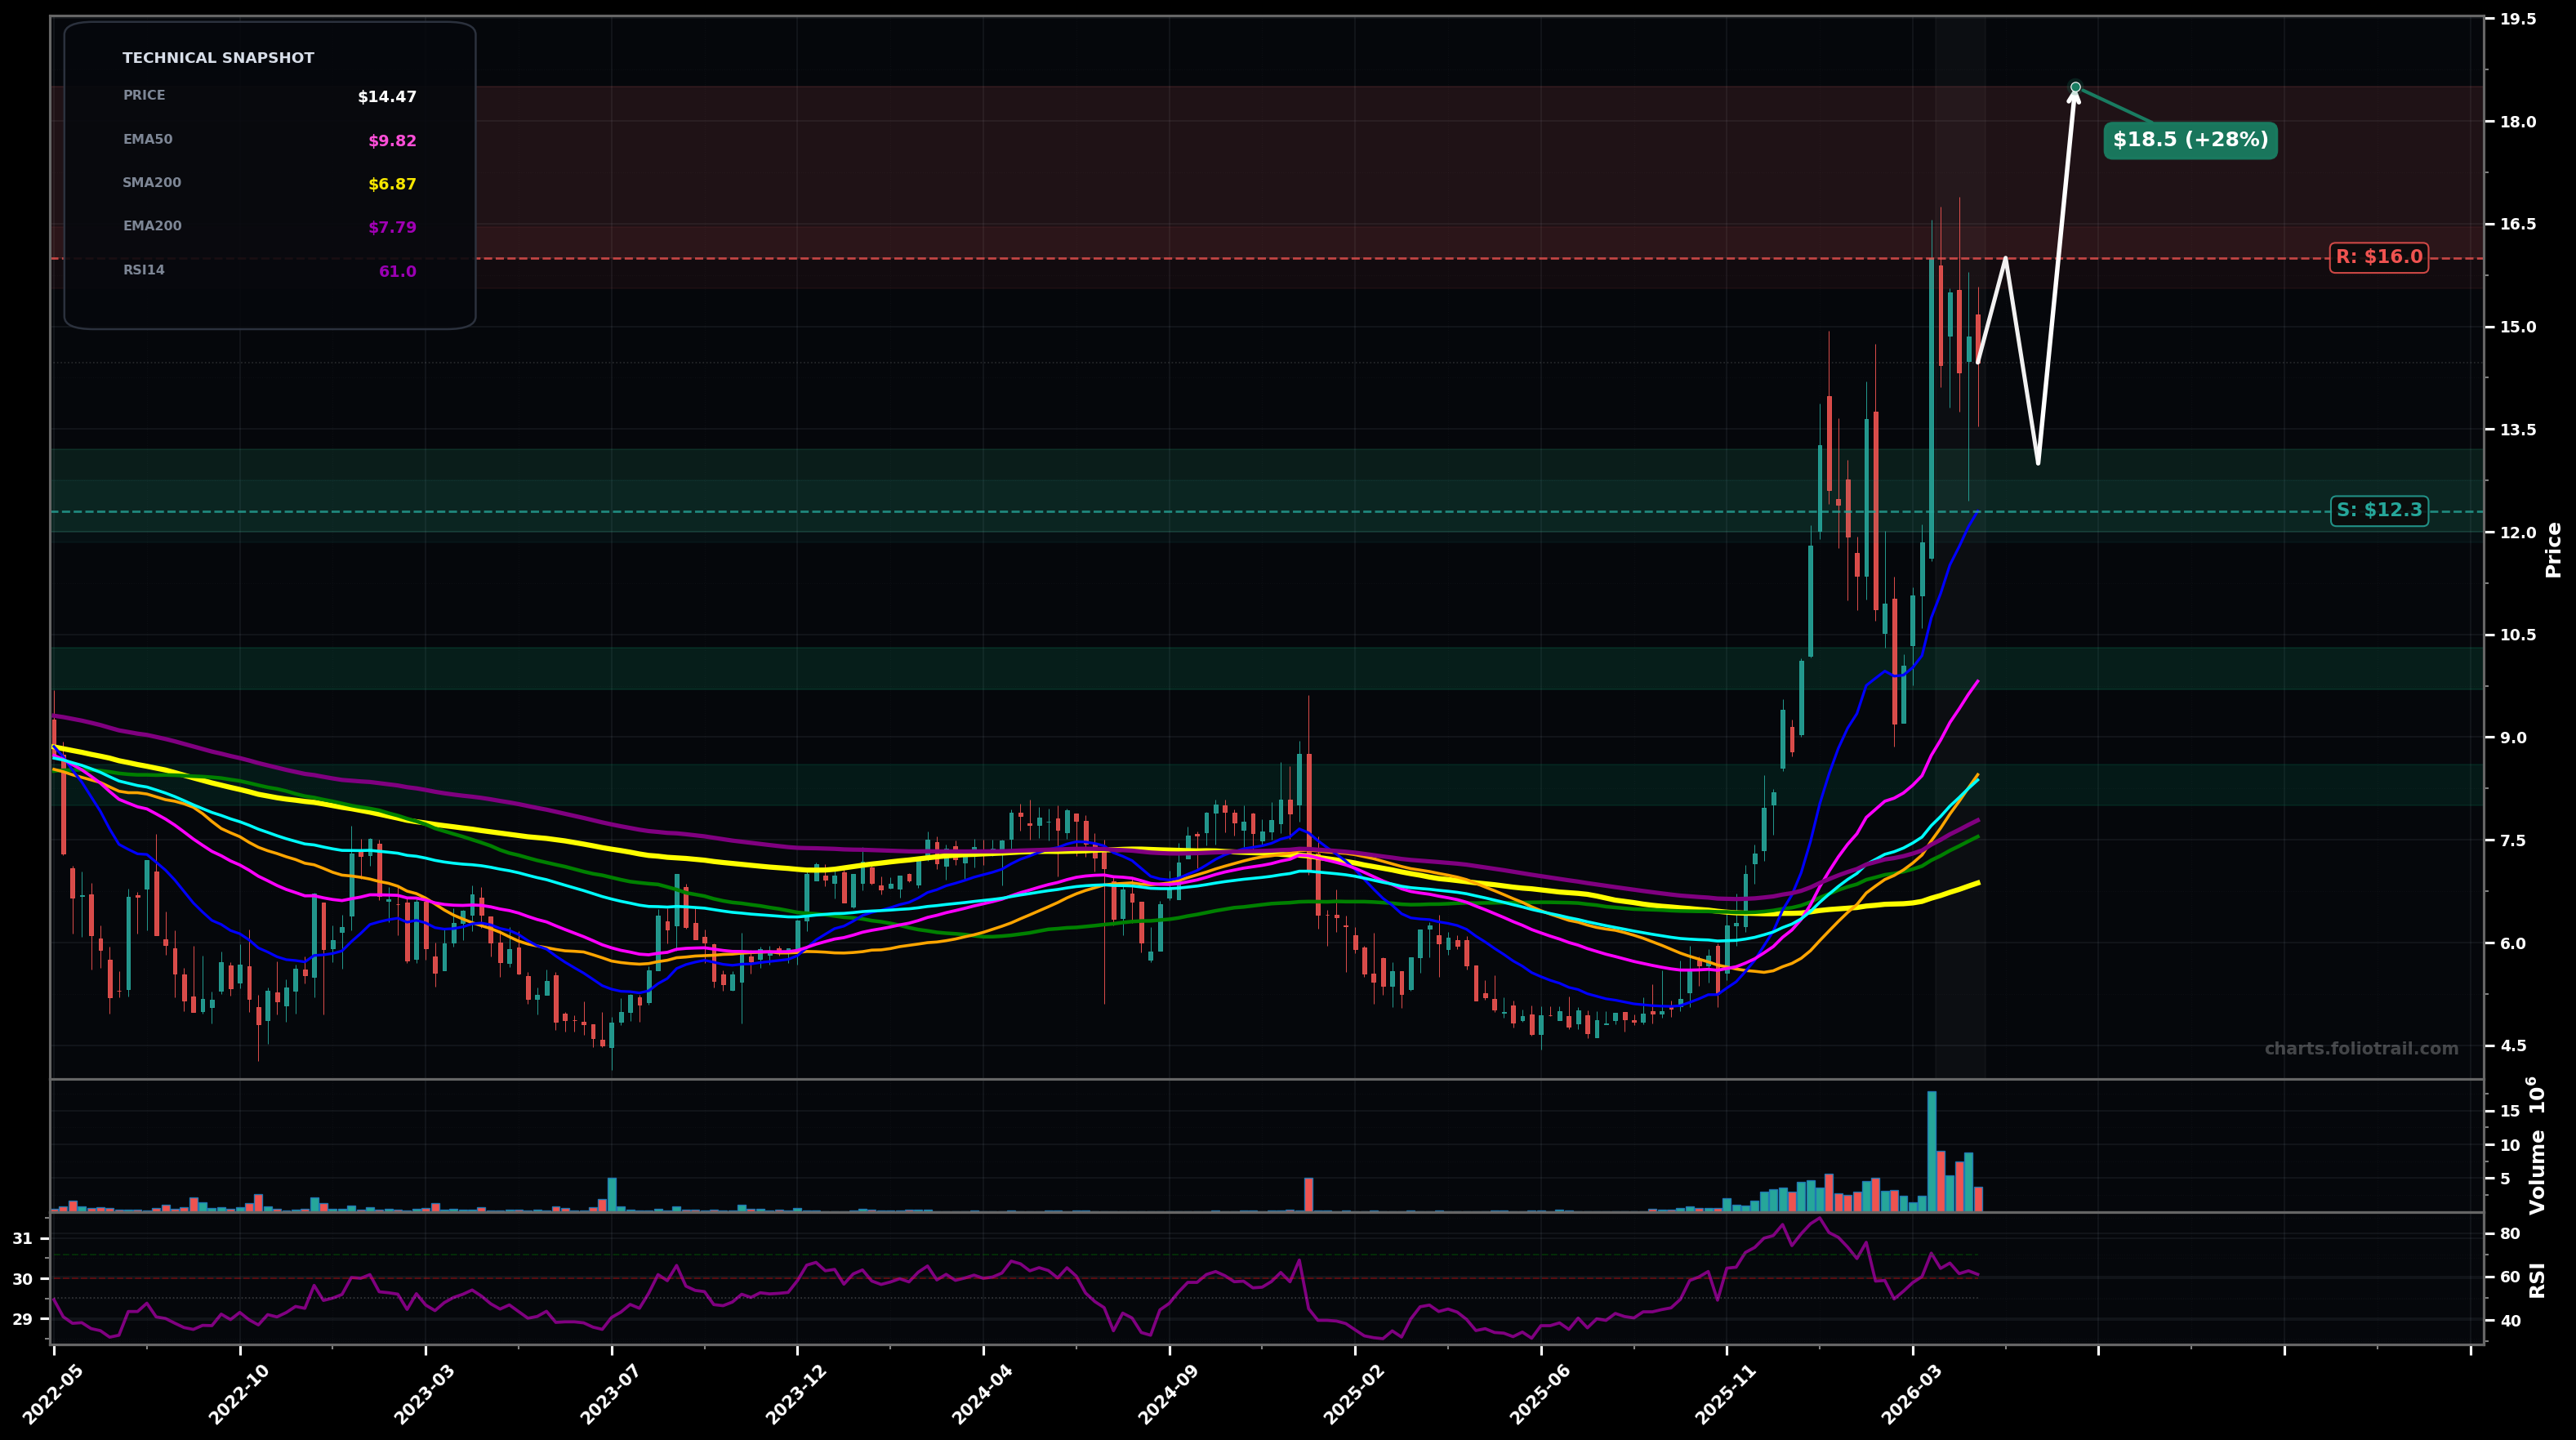
As of May 22, 2026, NEXA (Nexa Resources S.A.) is in a uptrend state on the weekly chart, with a confidence level of 72%. Key support is at $12.3 and key resistance at $16.0. Strong weekly breakout from long base; price at ~$14.47 after volatile spike to the mid-$16s and pullback; still holding well above rising EMA50 (~$9.82) with RSI ~61.
Bullish continuation after consolidation: price holds the ~$12.30–$13.00 pullback zone (near EMA20) and re-tests the $16 supply area; if absorbed, continuation toward the next extension.
Deeper ABC pullback (wave 4-like) after the impulsive run: rejection near $15–$16 leads to mean-reversion toward the rising EMA50; if buyers defend, the larger uptrend can resume later.
Weekly close above $16.00 (follow-through reclaim of the recent spike supply zone).
Weekly close below $9.80 (loss of EMA50 and prior breakout structure).
Start near EMA20/prior breakout retest; add on EMA50 (trend support); heavy add at EMA100/SMA50 cluster (~$8.4–$8.5) = deeper Fib-style retrace area if volatility expands.
Trim into prior spike supply ($16+) and likely extension zones; scale heavier as price becomes increasingly stretched vs rising EMA50/100 and prior range height, then fully exit on extreme multi-year extension/mania risk.
As of May 22, 2026, NEXA (Nexa Resources S.A.) is in a uptrend state on the weekly chart with 72% confidence. Strong weekly breakout from long base; price at ~$14.47 after volatile spike to the mid-$16s and pullback; still holding well above rising EMA50 (~$9.82) with RSI ~61.
On the weekly timeframe, NEXA has key support at $12.3 and key resistance at $16.0. The most likely scenario (bullish) targets $16.0 and $18.5, with a revert level at $13.0.
NEXA (Nexa Resources S.A.) is currently classified as uptrend on the weekly chart, with 72% confidence. Confirmation requires: Weekly close above $16.00 (follow-through reclaim of the recent spike supply zone). This would be invalidated by: Weekly close below $9.80 (loss of EMA50 and prior breakout structure).
The most likely scenario (bullish) targets $16.0 and $18.5, with a revert level at $13.0. The alternative scenario (bearish) targets $10.0 and $8.40.
Multi-layer AI agents analyse 200+ stocks across daily, weekly, and monthly timeframes — producing market state classifications, price scenarios with targets, and position entry/exit levels. Daily charts updated every trading day at 6 PM ET. Weekly charts refresh Fridays. Monthly charts refresh on the last trading day of each month. No paywall. No sign-up required.
Built by Foliotrail.
All content on this website — including charts, analysis, price targets, support/resistance levels, and position zones — is generated entirely by AI and provided for educational and informational purposes only.
This is not financial advice. NEXUSNOIR VENTURES SL (the operator of this website) is not a registered investment adviser or broker-dealer. You should not make investment decisions based solely on this information. Always do your own research and consult a qualified financial advisor.
By continuing, you acknowledge that you have read and agree to our full disclaimer & terms of use and privacy policy.