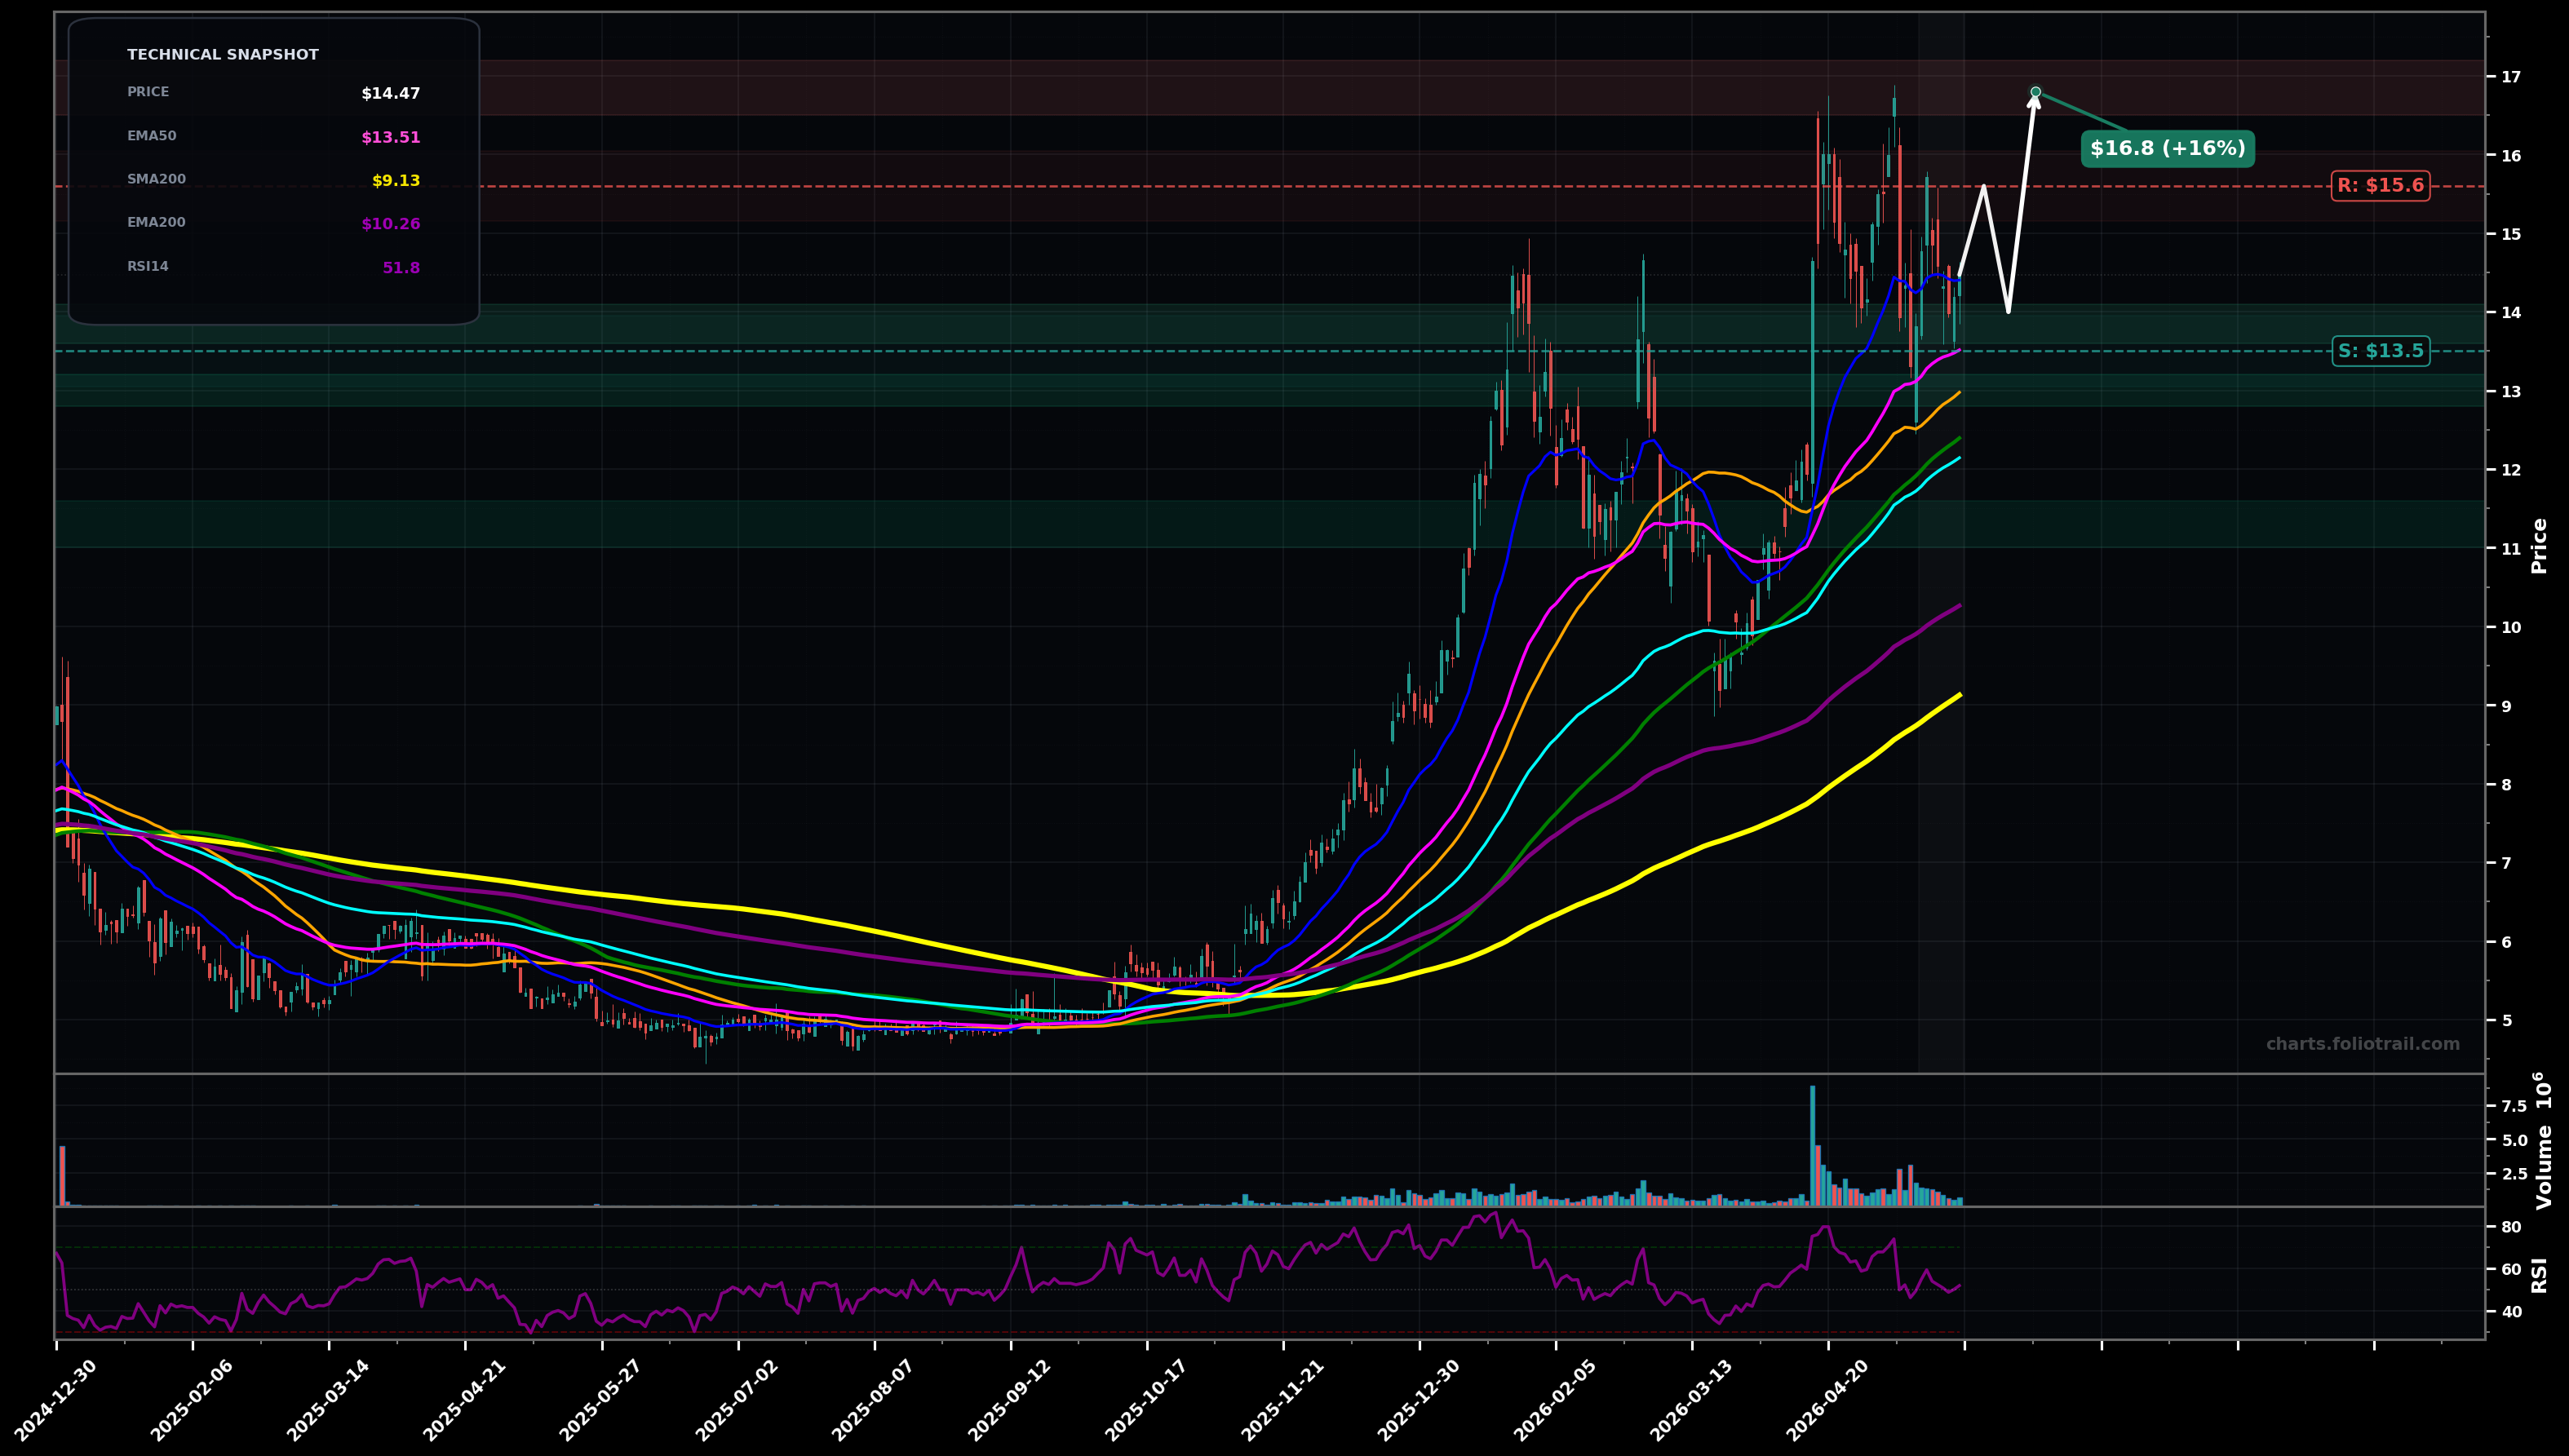
As of May 22, 2026, NEXA (Nexa Resources S.A.) is in a volatility expansion state on the daily chart, with a confidence level of 64%. Key support is at $13.5 and key resistance at $15.6. Price at $14.47 is consolidating after a sharp run-up; holding above EMA50 ($13.51) and reclaiming the short-term trend, with RSI ~51 (neutral).
Bullish continuation: volatility cools into a higher-low above $13.50-$13.80, then a push back through $15.60 aiming to retest the prior spike zone; Elliott view: wave (4) consolidation potentially complete, starting wave (5) attempt.
Bearish mean-reversion: lose EMA50 and drift to the confluence of SMA50 ($12.98)/SMA100 ($12.39)/EMA100 ($12.14); Elliott view: larger wave (4) still unfolding as an ABC with a deeper C-leg.
2 consecutive daily closes above $15.60 (then higher high attempt toward $16.80).
Daily close below $13.50 (loss of EMA50) increases odds of deeper mean reversion.
Start near EMA50 retest; add on confluence (SMA50/SMA100/EMA100) support; heavy add only on deeper pullback toward prior base/EMA200-area mean reversion.
Trim into prior spike high supply ($16.8 area); stronger trimming on potential Fib extension zone above prior high; full exit only if price becomes multi-year stretched vs long MAs (high-risk blow-off potential).
As of May 22, 2026, NEXA (Nexa Resources S.A.) is in a volatility expansion state on the daily chart with 64% confidence. Price at $14.47 is consolidating after a sharp run-up; holding above EMA50 ($13.51) and reclaiming the short-term trend, with RSI ~51 (neutral).
On the daily timeframe, NEXA has key support at $13.5 and key resistance at $15.6. The most likely scenario (bullish) targets $15.6 and $16.8, with a revert level at $14.0.
NEXA (Nexa Resources S.A.) is currently classified as volatility expansion on the daily chart, with 64% confidence. Confirmation requires: 2 consecutive daily closes above $15.60 (then higher high attempt toward $16.80). This would be invalidated by: Daily close below $13.50 (loss of EMA50) increases odds of deeper mean reversion.
The most likely scenario (bullish) targets $15.6 and $16.8, with a revert level at $14.0. The alternative scenario (bearish) targets $12.9 and $11.2.
Multi-layer AI agents analyse 200+ stocks across daily, weekly, and monthly timeframes — producing market state classifications, price scenarios with targets, and position entry/exit levels. Daily charts updated every trading day at 6 PM ET. Weekly charts refresh Fridays. Monthly charts refresh on the last trading day of each month. No paywall. No sign-up required.
Built by Foliotrail.
All content on this website — including charts, analysis, price targets, support/resistance levels, and position zones — is generated entirely by AI and provided for educational and informational purposes only.
This is not financial advice. NEXUSNOIR VENTURES SL (the operator of this website) is not a registered investment adviser or broker-dealer. You should not make investment decisions based solely on this information. Always do your own research and consult a qualified financial advisor.
By continuing, you acknowledge that you have read and agree to our full disclaimer & terms of use and privacy policy.