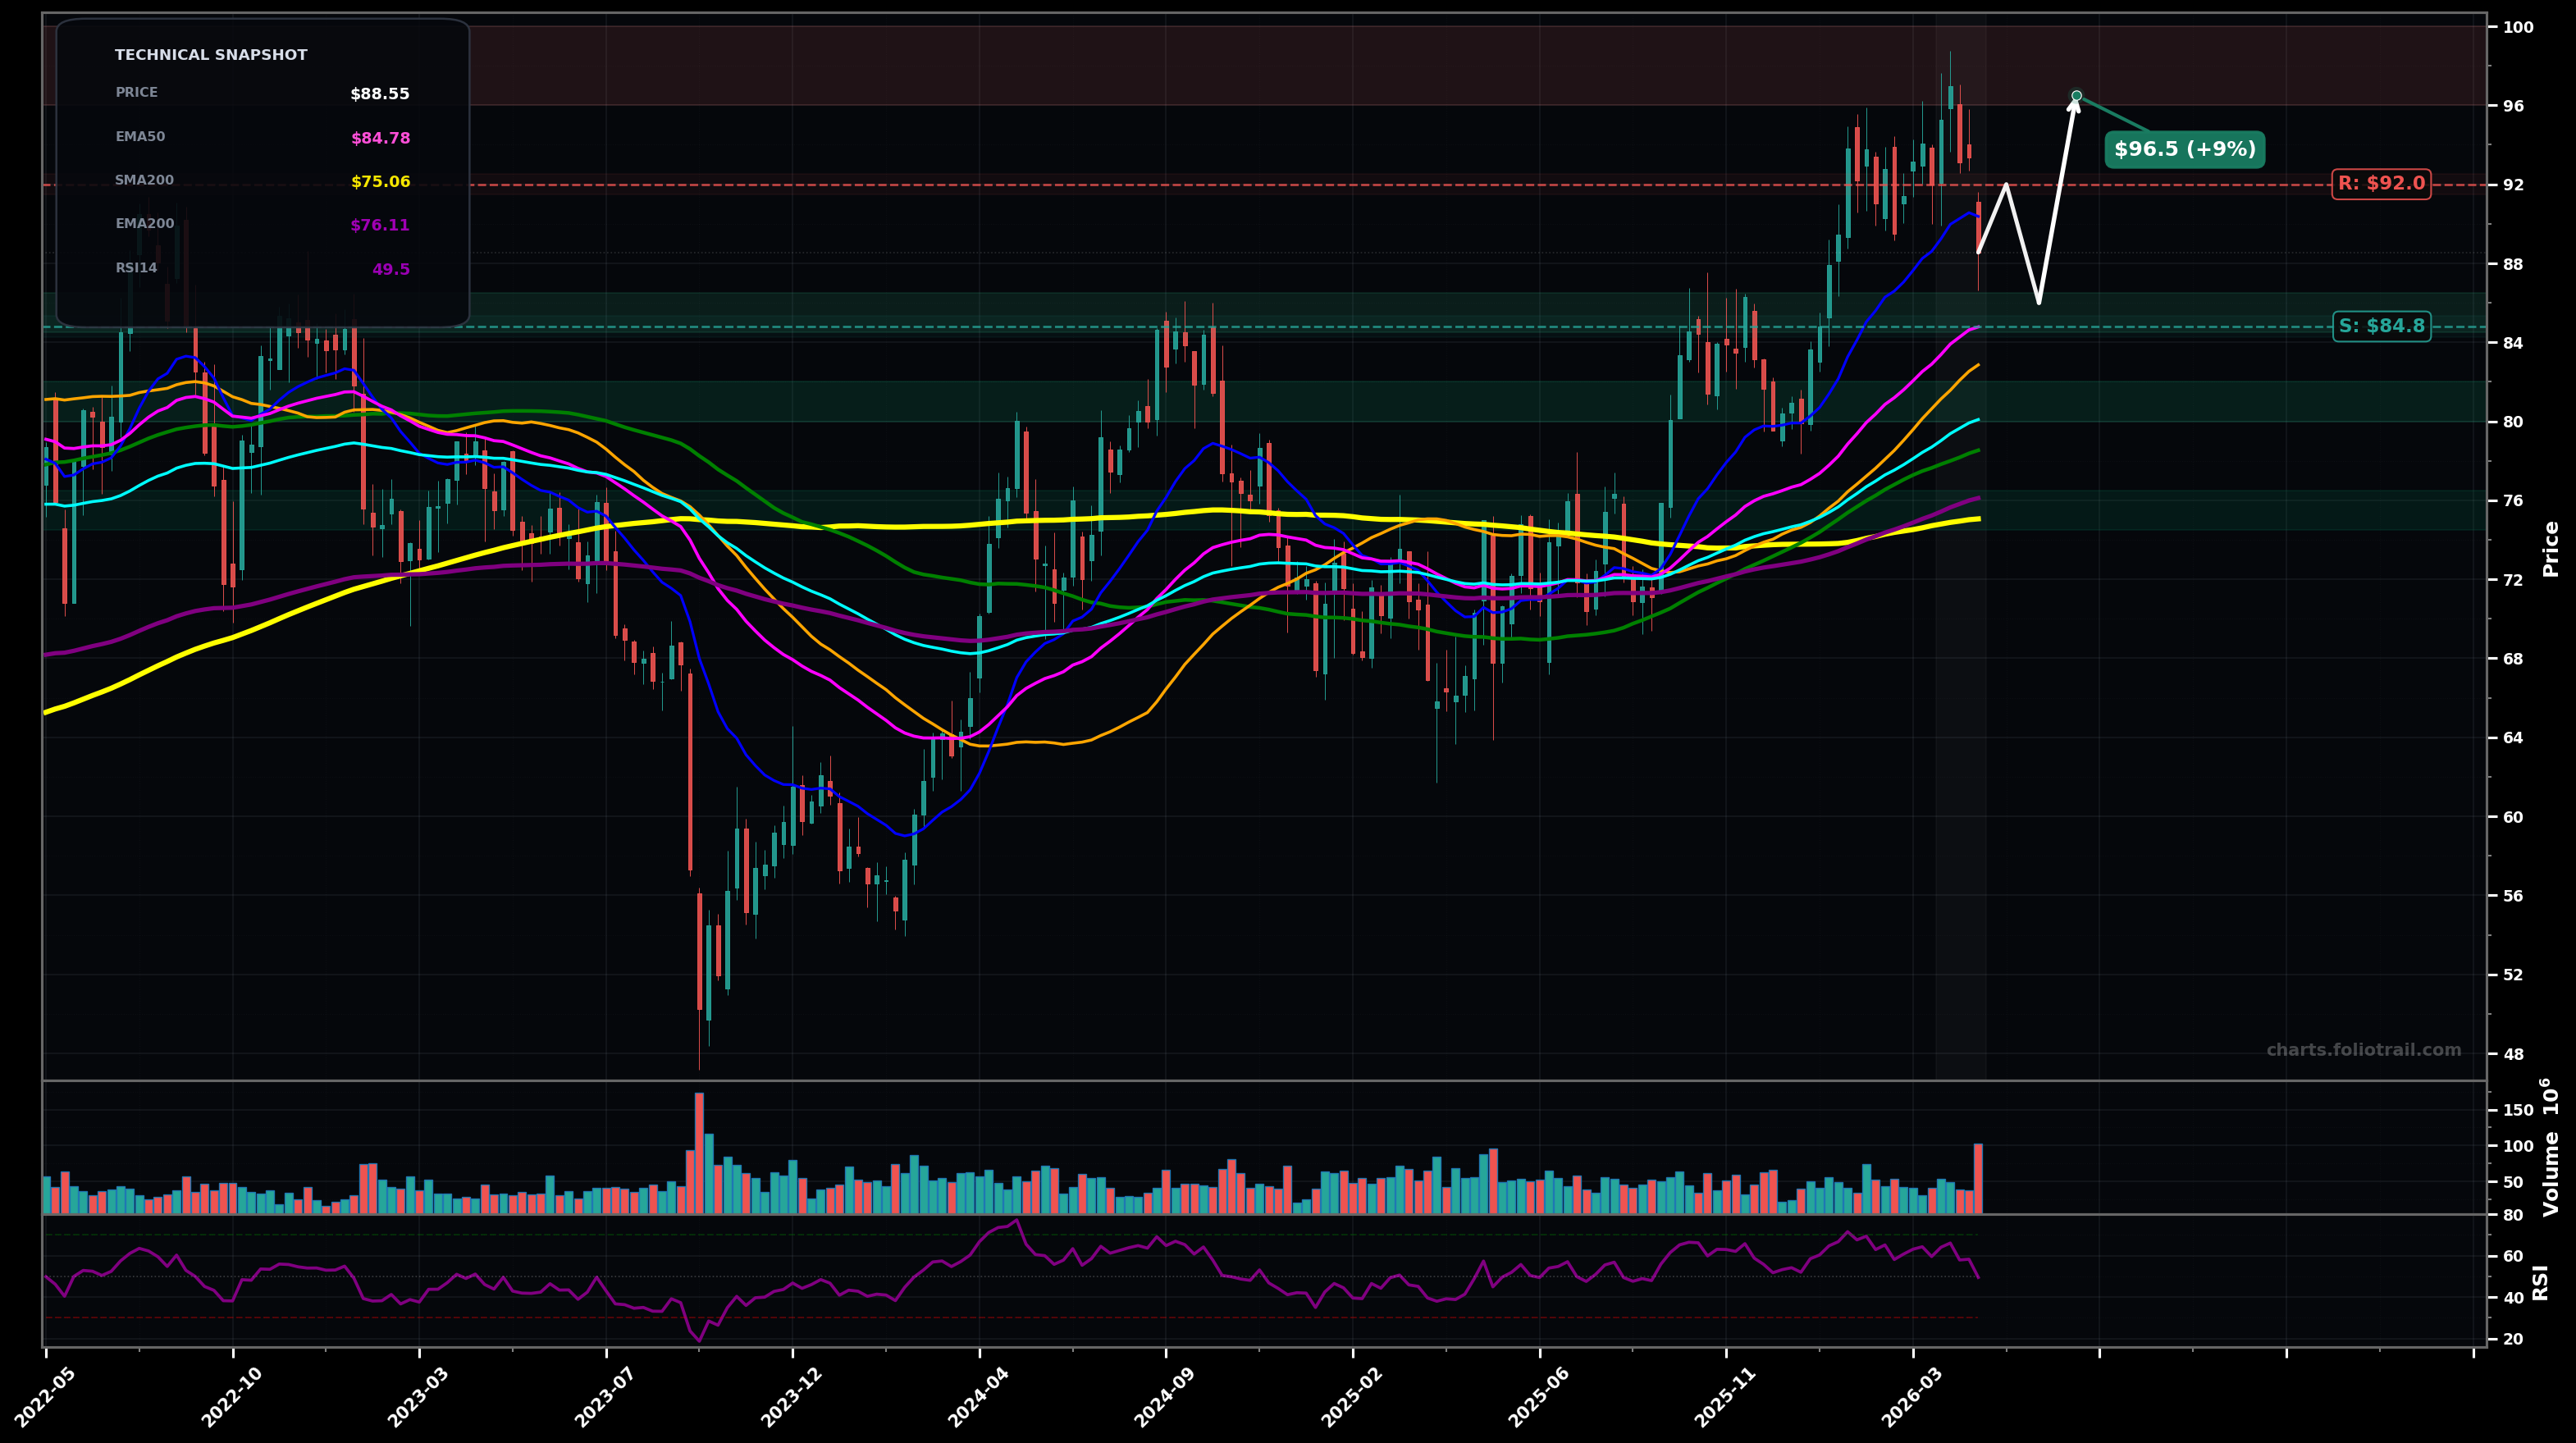
As of May 22, 2026, NEE (NextEra Energy, Inc.) is in a uptrend state on the weekly chart, with a confidence level of 66%. Key support is at $84.8 and key resistance at $92.0. After a strong breakout run to the mid-$90s, price pulled back sharply to ~$88.6 with momentum cooling (RSI ~49) but still holding above the rising EMA50 (~$84.8).
Bullish continuation: pullback resolves as a higher low above EMA50, then price reclaims $92 and retests the prior highs (~$96). Elliott-wave view: this looks like a Wave (4) pullback after an impulsive Wave (3) run from the ~$65 area; next leg would be Wave (5). Fib: a typical Wave (4) often holds ~38.2% retrace of the ~$65→~$96 advance (roughly mid-$80s), aligning with EMA50.
Bearish weekly correction: failure to reclaim $92 and a breakdown under EMA50 leads to mean reversion into the thick MA shelf ($80–$82), with a possible overshoot toward the prior consolidation/swing area in the mid-$70s. Elliott-wave alternate: the move to ~$96 was a completed 5-wave sequence, and this is an A-B-C correction targeting deeper fib retraces (50%/61.8%).
Weekly close back above $92.00 (and holding for 2 closes) would confirm trend continuation after this pullback
Weekly close below $84.50 would invalidate the immediate uptrend and shift risk to a deeper weekly correction
Start near rising EMA50/likely Wave(4) support; add at MA-confluence shelf (EMA100/SMA50 area); heavy add near prior range support + deeper fib retrace zone if weekly trend breaks.
Trim into prior-high resistance first, then scale out if price extends well above the MA stack and into fib-extension territory where upside becomes increasingly sentiment-driven and prone to multi-month mean reversion.
As of May 22, 2026, NEE (NextEra Energy, Inc.) is in a uptrend state on the weekly chart with 66% confidence. After a strong breakout run to the mid-$90s, price pulled back sharply to ~$88.6 with momentum cooling (RSI ~49) but still holding above the rising EMA50 (~$84.8).
On the weekly timeframe, NEE has key support at $84.8 and key resistance at $92.0. The most likely scenario (bullish) targets $92.0 and $96.5, with a revert level at $86.0.
NEE (NextEra Energy, Inc.) is currently classified as uptrend on the weekly chart, with 66% confidence. Confirmation requires: Weekly close back above $92.00 (and holding for 2 closes) would confirm trend continuation after this pullback This would be invalidated by: Weekly close below $84.50 would invalidate the immediate uptrend and shift risk to a deeper weekly correction
The most likely scenario (bullish) targets $92.0 and $96.5, with a revert level at $86.0. The alternative scenario (bearish) targets $80.0 and $75.0.
Multi-layer AI agents analyse 200+ stocks across daily, weekly, and monthly timeframes — producing market state classifications, price scenarios with targets, and position entry/exit levels. Daily charts updated every trading day at 6 PM ET. Weekly charts refresh Fridays. Monthly charts refresh on the last trading day of each month. No paywall. No sign-up required.
Built by Foliotrail.
All content on this website — including charts, analysis, price targets, support/resistance levels, and position zones — is generated entirely by AI and provided for educational and informational purposes only.
This is not financial advice. NEXUSNOIR VENTURES SL (the operator of this website) is not a registered investment adviser or broker-dealer. You should not make investment decisions based solely on this information. Always do your own research and consult a qualified financial advisor.
By continuing, you acknowledge that you have read and agree to our full disclaimer & terms of use and privacy policy.