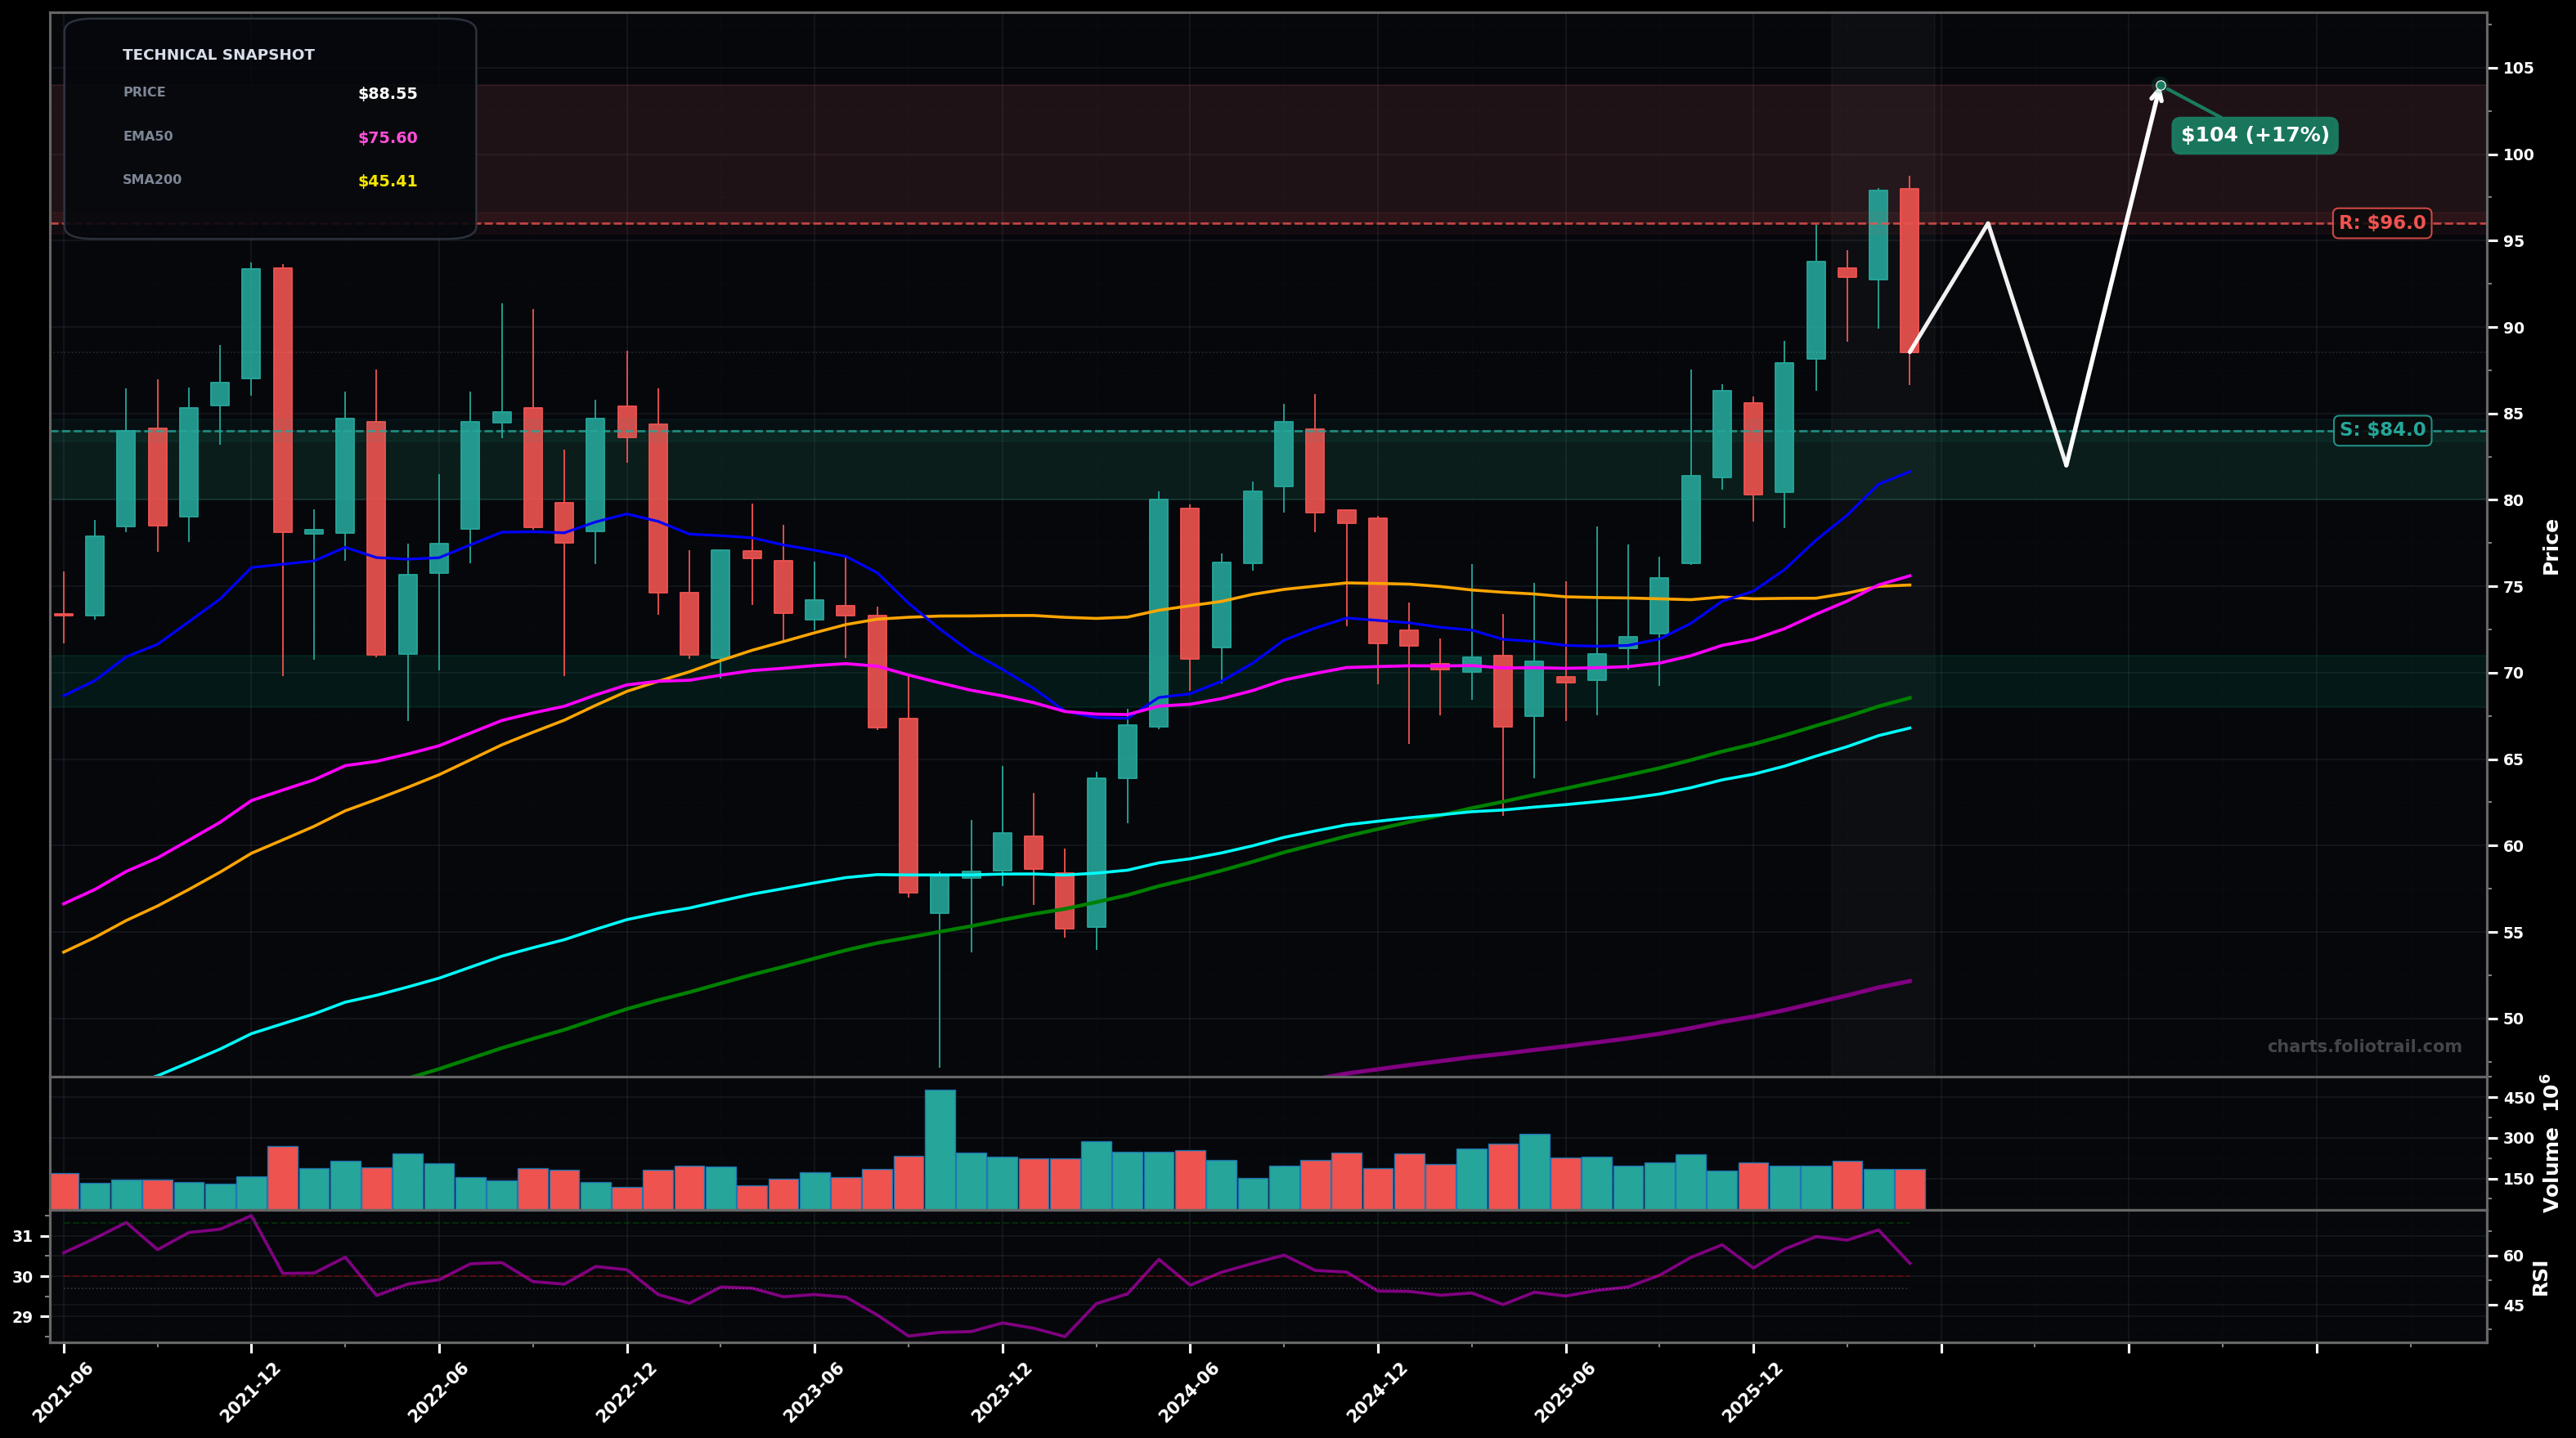
As of May 22, 2026, NEE (NextEra Energy, Inc.) is in a uptrend state on the monthly chart, with a confidence level of 68%. Key support is at $84.0 and key resistance at $96.0. Monthly uptrend intact but last candle is a sharp pullback from ~$97 into ~$88.6 after a strong multi-month rally (RSI ~58).
Bullish continuation after a controlled pullback: price holds the ~$84–$80 area (prior breakout / mid-range support), then retests ~$96 and attempts a new HH. Rough probability ~60%. Elliott view: likely Wave 4 pullback within a larger impulsive advance; Fib retrace focus ~38.2% ($~81) to 50% ($~76) of the ~$55→$97 leg.
Deeper mean-reversion: rejection under ~$91 leads to a larger retrace into the moving-average cluster (EMA50/SMA50) before the next major decision. Rough probability ~40%. Elliott view: Wave 4 deepens (flat/zigzag) before any Wave 5 attempt; watch for loss of the most recent swing-low reference around low-$80s.
Monthly close back above ~$91 would confirm dip-buying strength and trend continuation.
Monthly close below ~$75 would invalidate the near-term uptrend structure (loss of EMA50/SMA50 area).
Start near prior breakout support (~$84) / likely Fib 38.2% area; add into EMA50/SMA50 confluence (~$75–$78); heavy add near SMA100/EMA100 region (~$69) if structure still stabilizes.
Trim into prior high / measured extension zones ($96+), intensify trims on potential Fib extensions above $104, and consider full exit only if price becomes materially stretched vs rising averages (parabolic-like) into $118–$130.
As of May 22, 2026, NEE (NextEra Energy, Inc.) is in a uptrend state on the monthly chart with 68% confidence. Monthly uptrend intact but last candle is a sharp pullback from ~$97 into ~$88.6 after a strong multi-month rally (RSI ~58).
On the monthly timeframe, NEE has key support at $84.0 and key resistance at $96.0. The most likely scenario (bullish) targets $96.0 and $104, with a revert level at $82.0.
NEE (NextEra Energy, Inc.) is currently classified as uptrend on the monthly chart, with 68% confidence. Confirmation requires: Monthly close back above ~$91 would confirm dip-buying strength and trend continuation. This would be invalidated by: Monthly close below ~$75 would invalidate the near-term uptrend structure (loss of EMA50/SMA50 area).
The most likely scenario (bullish) targets $96.0 and $104, with a revert level at $82.0. The alternative scenario (bearish) targets $76.0 and $69.0.
Multi-layer AI agents analyse 200+ stocks across daily, weekly, and monthly timeframes — producing market state classifications, price scenarios with targets, and position entry/exit levels. Daily charts updated every trading day at 6 PM ET. Weekly charts refresh Fridays. Monthly charts refresh on the last trading day of each month. No paywall. No sign-up required.
Built by Foliotrail.
All content on this website — including charts, analysis, price targets, support/resistance levels, and position zones — is generated entirely by AI and provided for educational and informational purposes only.
This is not financial advice. NEXUSNOIR VENTURES SL (the operator of this website) is not a registered investment adviser or broker-dealer. You should not make investment decisions based solely on this information. Always do your own research and consult a qualified financial advisor.
By continuing, you acknowledge that you have read and agree to our full disclaimer & terms of use and privacy policy.