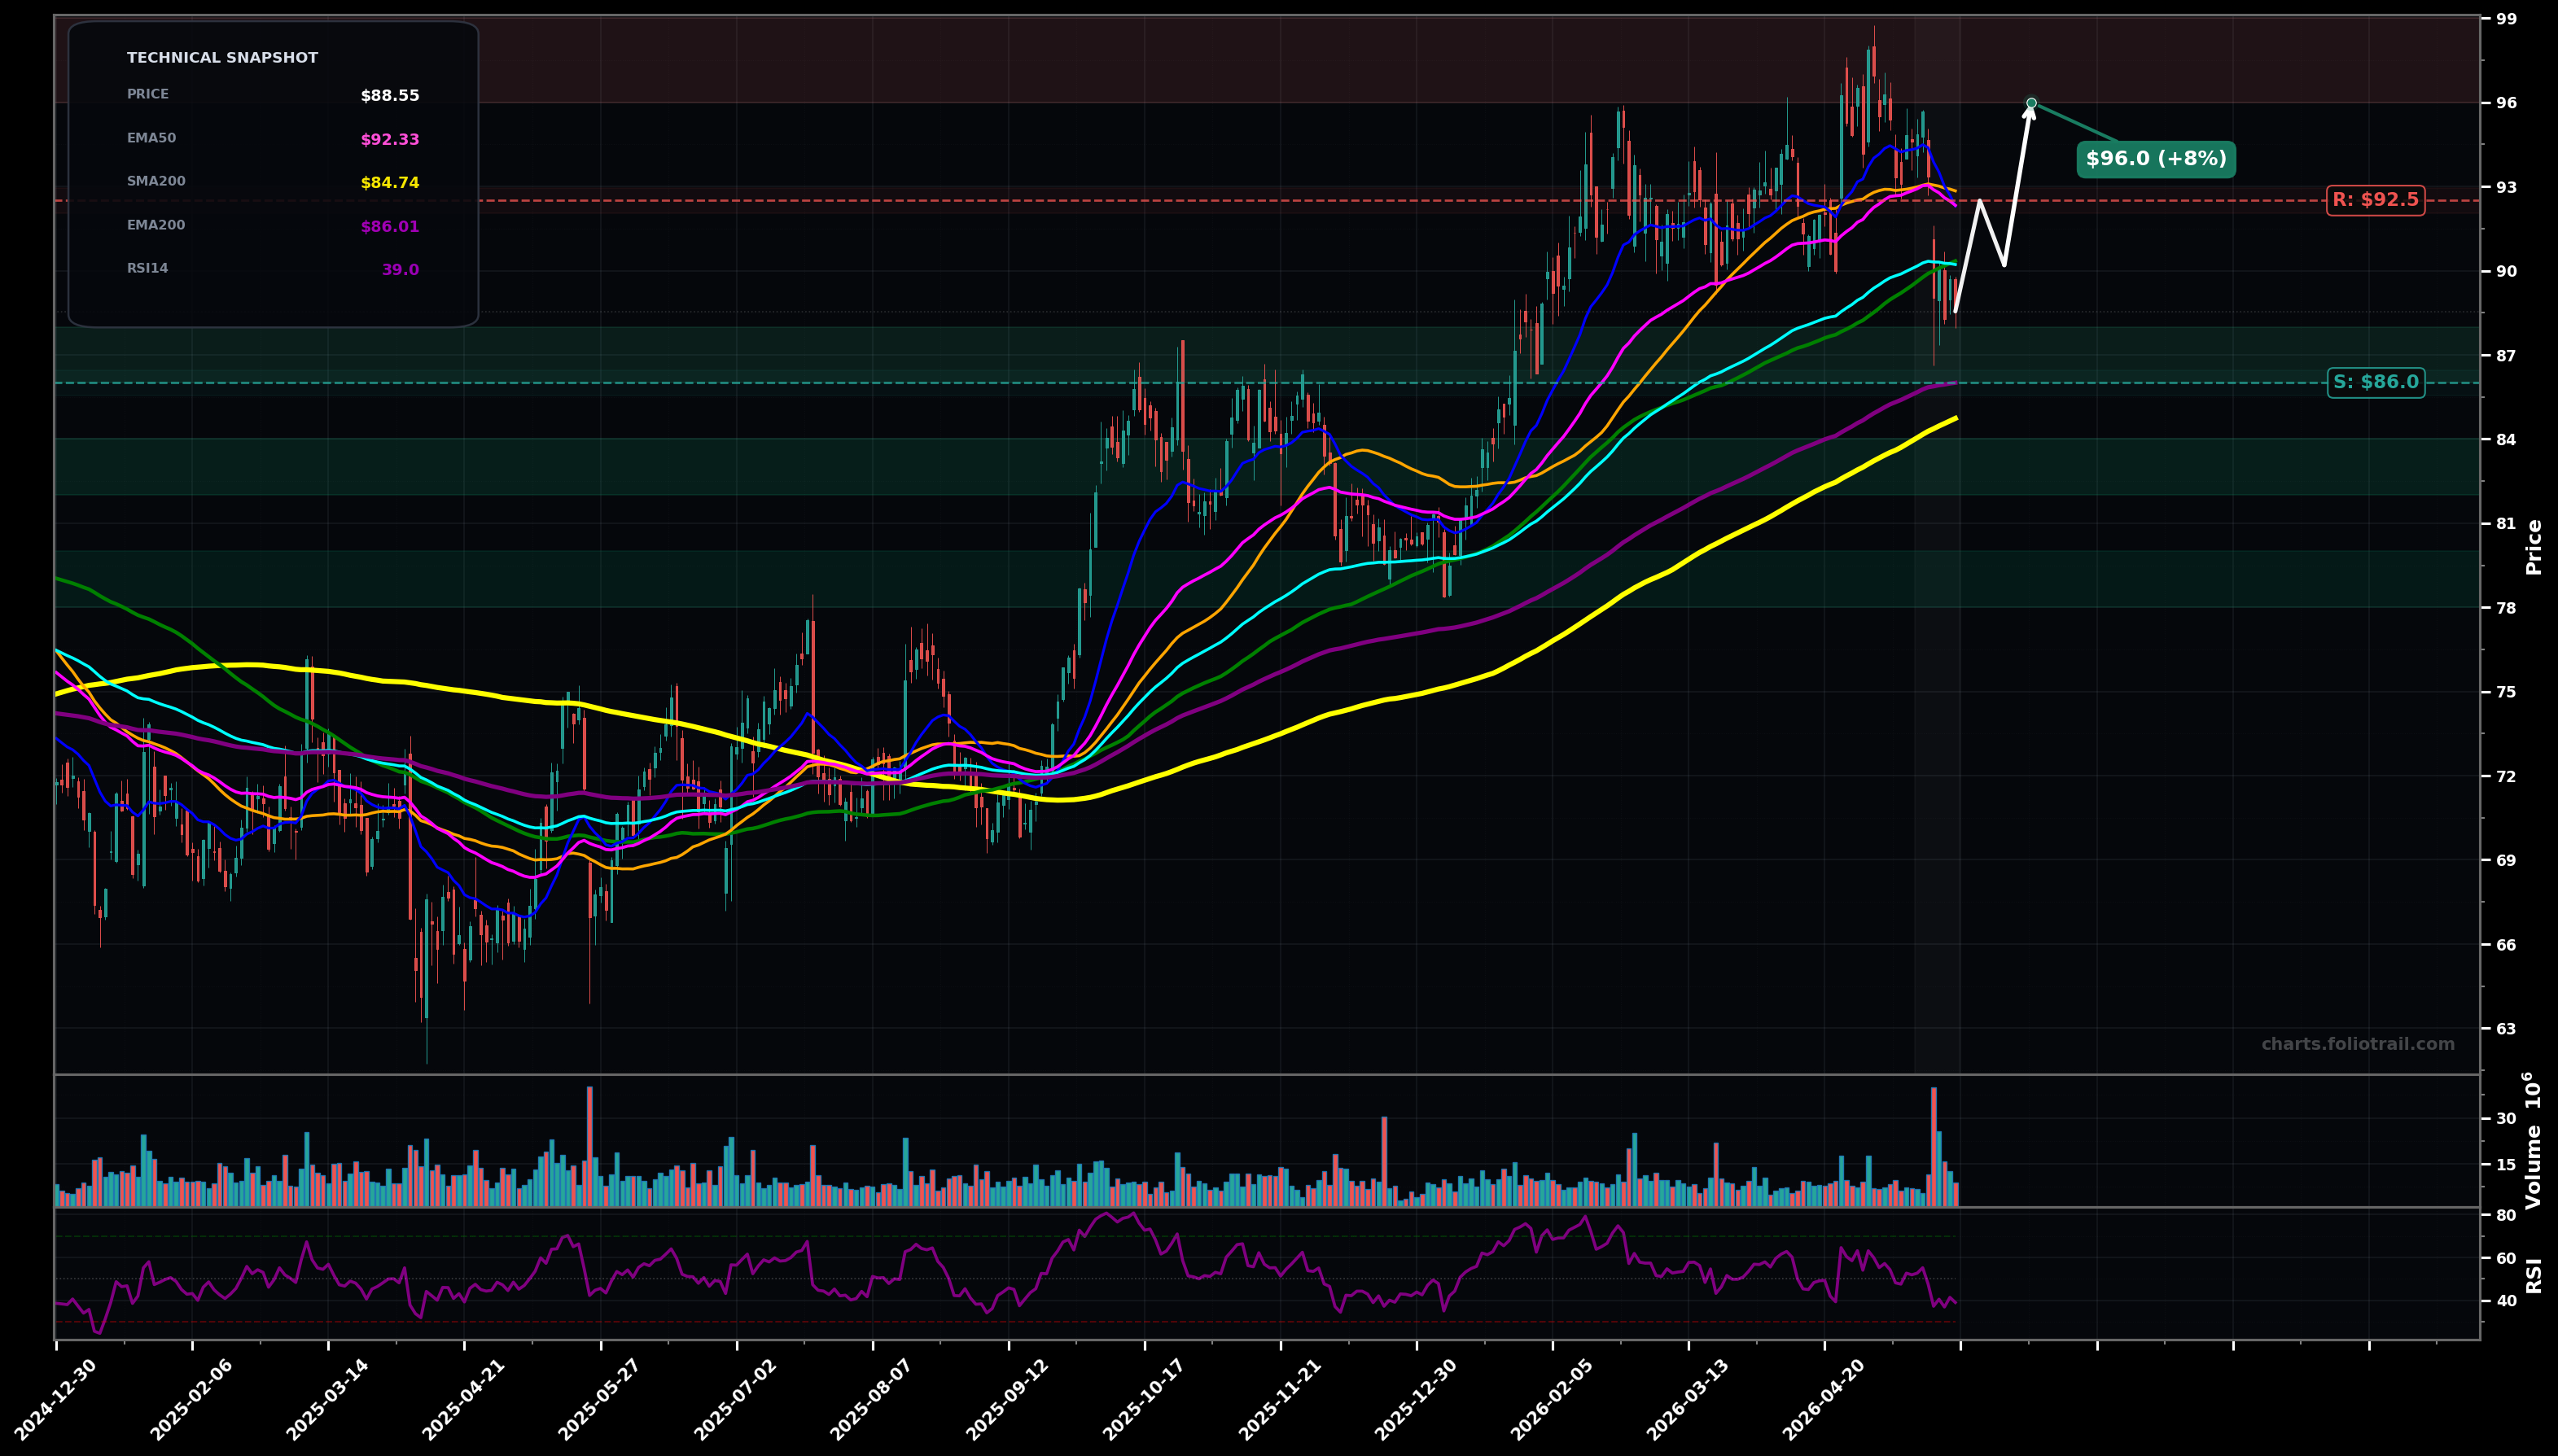
As of May 22, 2026, NEE (NextEra Energy, Inc.) is in a bottoming attempt state on the daily chart, with a confidence level of 64%. Key support is at $86.0 and key resistance at $92.5. Price sold off from the ~$96-$98 swing high, broke below EMA50/EMA20 and is now sitting under EMA100/SMA100 with RSI ~39 (weak momentum) while longer-term SMA200/EMA200 remain below price.
Mean-reversion bounce from the $86-$88 support cluster (EMA200/SMA200 nearby), forming a higher low and pushing back into the $92-$93 supply (EMA50/SMA50) before deciding direction.
Support fails: price loses $86 and accelerates into a deeper fib retrace of the prior up-leg (from ~$72 to ~$98), targeting the ~$82 area (61.8%) and possibly the high-$70s (78.6%) before any durable base.
2+ daily closes back above $92.50 (reclaim EMA50/SMA50 zone)
Daily close below $86.00 (loss of EMA200 ~$86.01 + prior pivot support)
Start near EMA200/SMA200 + recent swing-low area; add on 61.8% retrace; heavy add near 78.6% retrace/major prior structure if breakdown occurs.
Trim into prior swing-high supply ($96-$99); heavier trims on extension above prior high; close on multi-year stretch/extended wave-5 style blowoff above new ATH zone.
As of May 22, 2026, NEE (NextEra Energy, Inc.) is in a bottoming attempt state on the daily chart with 64% confidence. Price sold off from the ~$96-$98 swing high, broke below EMA50/EMA20 and is now sitting under EMA100/SMA100 with RSI ~39 (weak momentum) while longer-term SMA200/EMA200 remain below price.
On the daily timeframe, NEE has key support at $86.0 and key resistance at $92.5. The most likely scenario (bullish) targets $92.5 and $96.0, with a revert level at $90.2.
NEE (NextEra Energy, Inc.) is currently classified as bottoming attempt on the daily chart, with 64% confidence. Confirmation requires: 2+ daily closes back above $92.50 (reclaim EMA50/SMA50 zone) This would be invalidated by: Daily close below $86.00 (loss of EMA200 ~$86.01 + prior pivot support)
The most likely scenario (bullish) targets $92.5 and $96.0, with a revert level at $90.2. The alternative scenario (bearish) targets $82.0 and $78.0.
Multi-layer AI agents analyse 200+ stocks across daily, weekly, and monthly timeframes — producing market state classifications, price scenarios with targets, and position entry/exit levels. Daily charts updated every trading day at 6 PM ET. Weekly charts refresh Fridays. Monthly charts refresh on the last trading day of each month. No paywall. No sign-up required.
Built by Foliotrail.
All content on this website — including charts, analysis, price targets, support/resistance levels, and position zones — is generated entirely by AI and provided for educational and informational purposes only.
This is not financial advice. NEXUSNOIR VENTURES SL (the operator of this website) is not a registered investment adviser or broker-dealer. You should not make investment decisions based solely on this information. Always do your own research and consult a qualified financial advisor.
By continuing, you acknowledge that you have read and agree to our full disclaimer & terms of use and privacy policy.