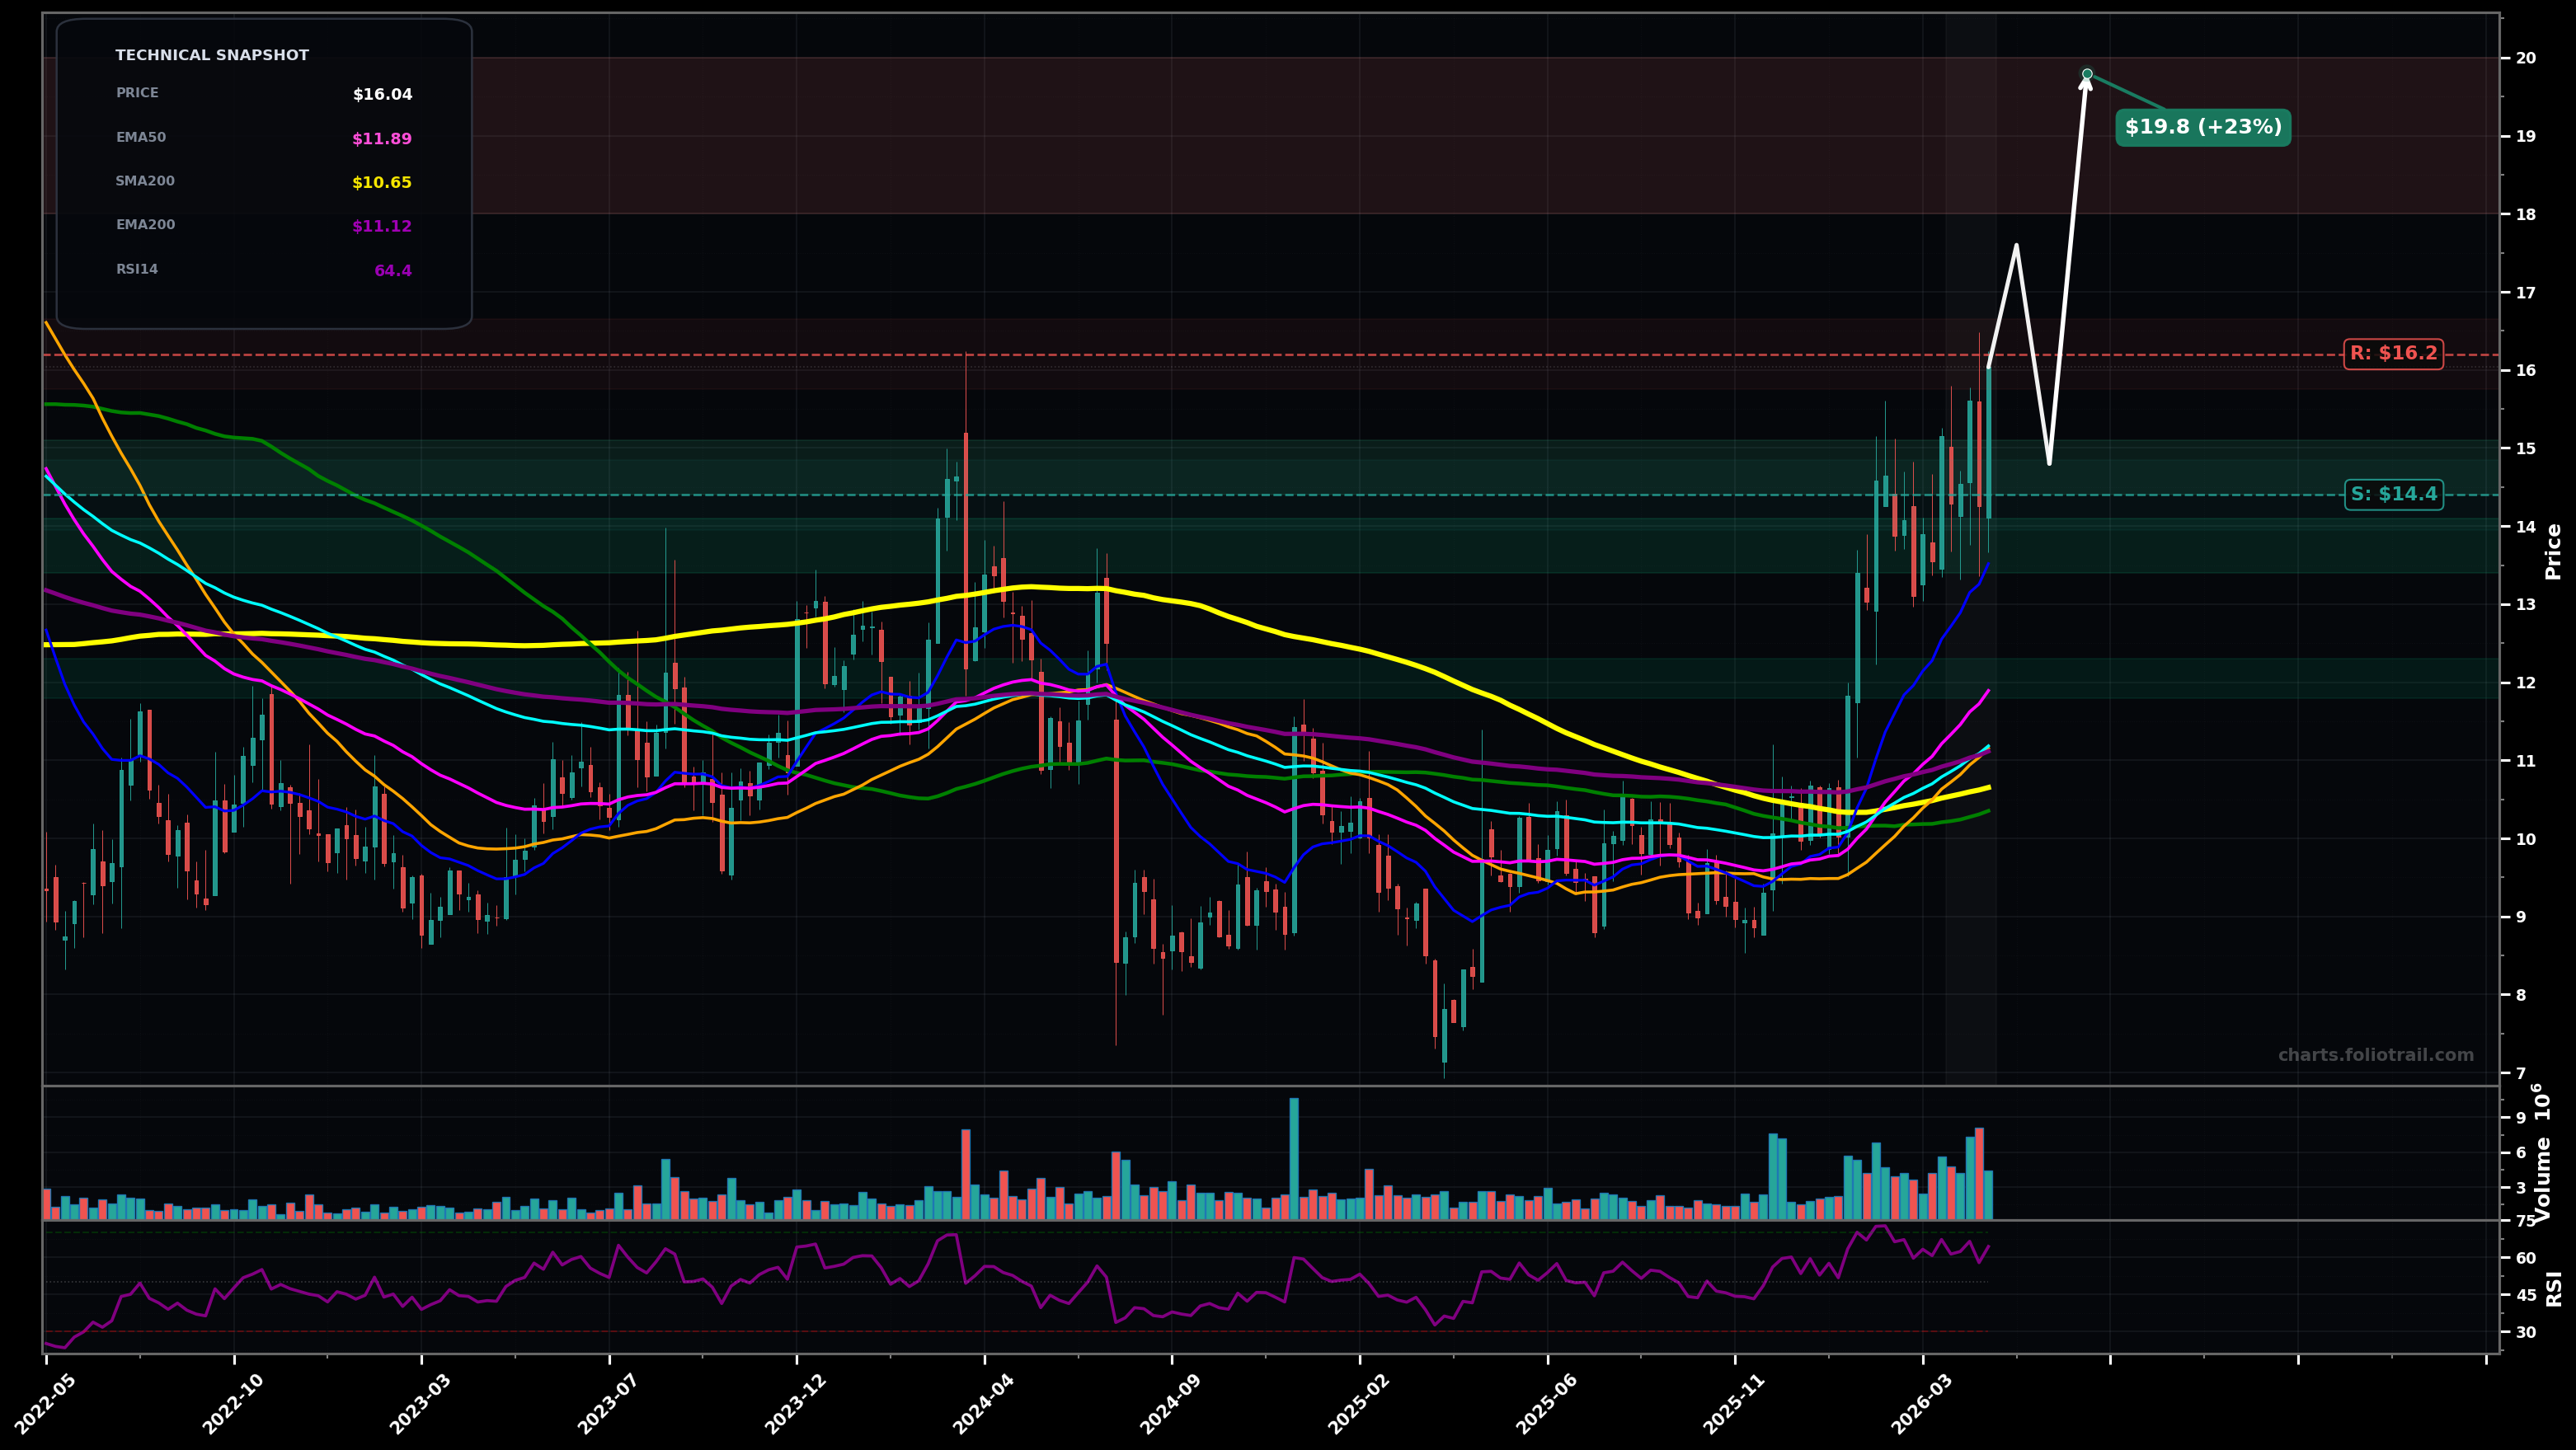
As of May 22, 2026, MITK (Mitek Systems Inc.) is in a uptrend state on the weekly chart, with a confidence level of 72%. Key support is at $14.4 and key resistance at $16.2. Strong weekly breakout with follow-through; price at ~$16.04 is extended above all key EMAs/SMAs on rising volume; RSI(14) ~64 (bullish momentum, not extreme).
Bullish continuation after a brief digestion: pullback/consolidation toward ~$14.40-$15.00, then push to a measured move / Fib extension into the high teens.
Deeper mean reversion: breakout fades, price retests rising MA cluster (EMA50/100 zone) before deciding; still a constructive higher-low setup if it holds.
Weekly closes hold above ~$14.40 (prior breakout/swing area) for 2+ weeks
Weekly close below ~$13.50 (EMA20 area) would signal failed breakout / deeper pullback risk
Buy the breakout retest first ($14.4-$15.1), add on a deeper HL near EMA20/previous breakout shelf ($13.4-$14.1), heavy add only if a full MA-cluster retest occurs near EMA50/100 (~$12) while structure stays intact.
Trim into likely Fib extension/momentum peaks above current swing ($18-$20 first), trim more if price becomes far stretched vs rising EMA50/100 ($22.5-$25), and consider full exit on parabolic overshoot/major extension ($28-$32).
As of May 22, 2026, MITK (Mitek Systems Inc.) is in a uptrend state on the weekly chart with 72% confidence. Strong weekly breakout with follow-through; price at ~$16.04 is extended above all key EMAs/SMAs on rising volume; RSI(14) ~64 (bullish momentum, not extreme).
On the weekly timeframe, MITK has key support at $14.4 and key resistance at $16.2. The most likely scenario (bullish) targets $17.6 and $19.8, with a revert level at $14.8.
MITK (Mitek Systems Inc.) is currently classified as uptrend on the weekly chart, with 72% confidence. Confirmation requires: Weekly closes hold above ~$14.40 (prior breakout/swing area) for 2+ weeks This would be invalidated by: Weekly close below ~$13.50 (EMA20 area) would signal failed breakout / deeper pullback risk
The most likely scenario (bullish) targets $17.6 and $19.8, with a revert level at $14.8. The alternative scenario (bearish) targets $13.5 and $11.9.
Multi-layer AI agents analyse 200+ stocks across daily, weekly, and monthly timeframes — producing market state classifications, price scenarios with targets, and position entry/exit levels. Daily charts updated every trading day at 6 PM ET. Weekly charts refresh Fridays. Monthly charts refresh on the last trading day of each month. No paywall. No sign-up required.
Built by Foliotrail.
All content on this website — including charts, analysis, price targets, support/resistance levels, and position zones — is generated entirely by AI and provided for educational and informational purposes only.
This is not financial advice. NEXUSNOIR VENTURES SL (the operator of this website) is not a registered investment adviser or broker-dealer. You should not make investment decisions based solely on this information. Always do your own research and consult a qualified financial advisor.
By continuing, you acknowledge that you have read and agree to our full disclaimer & terms of use and privacy policy.