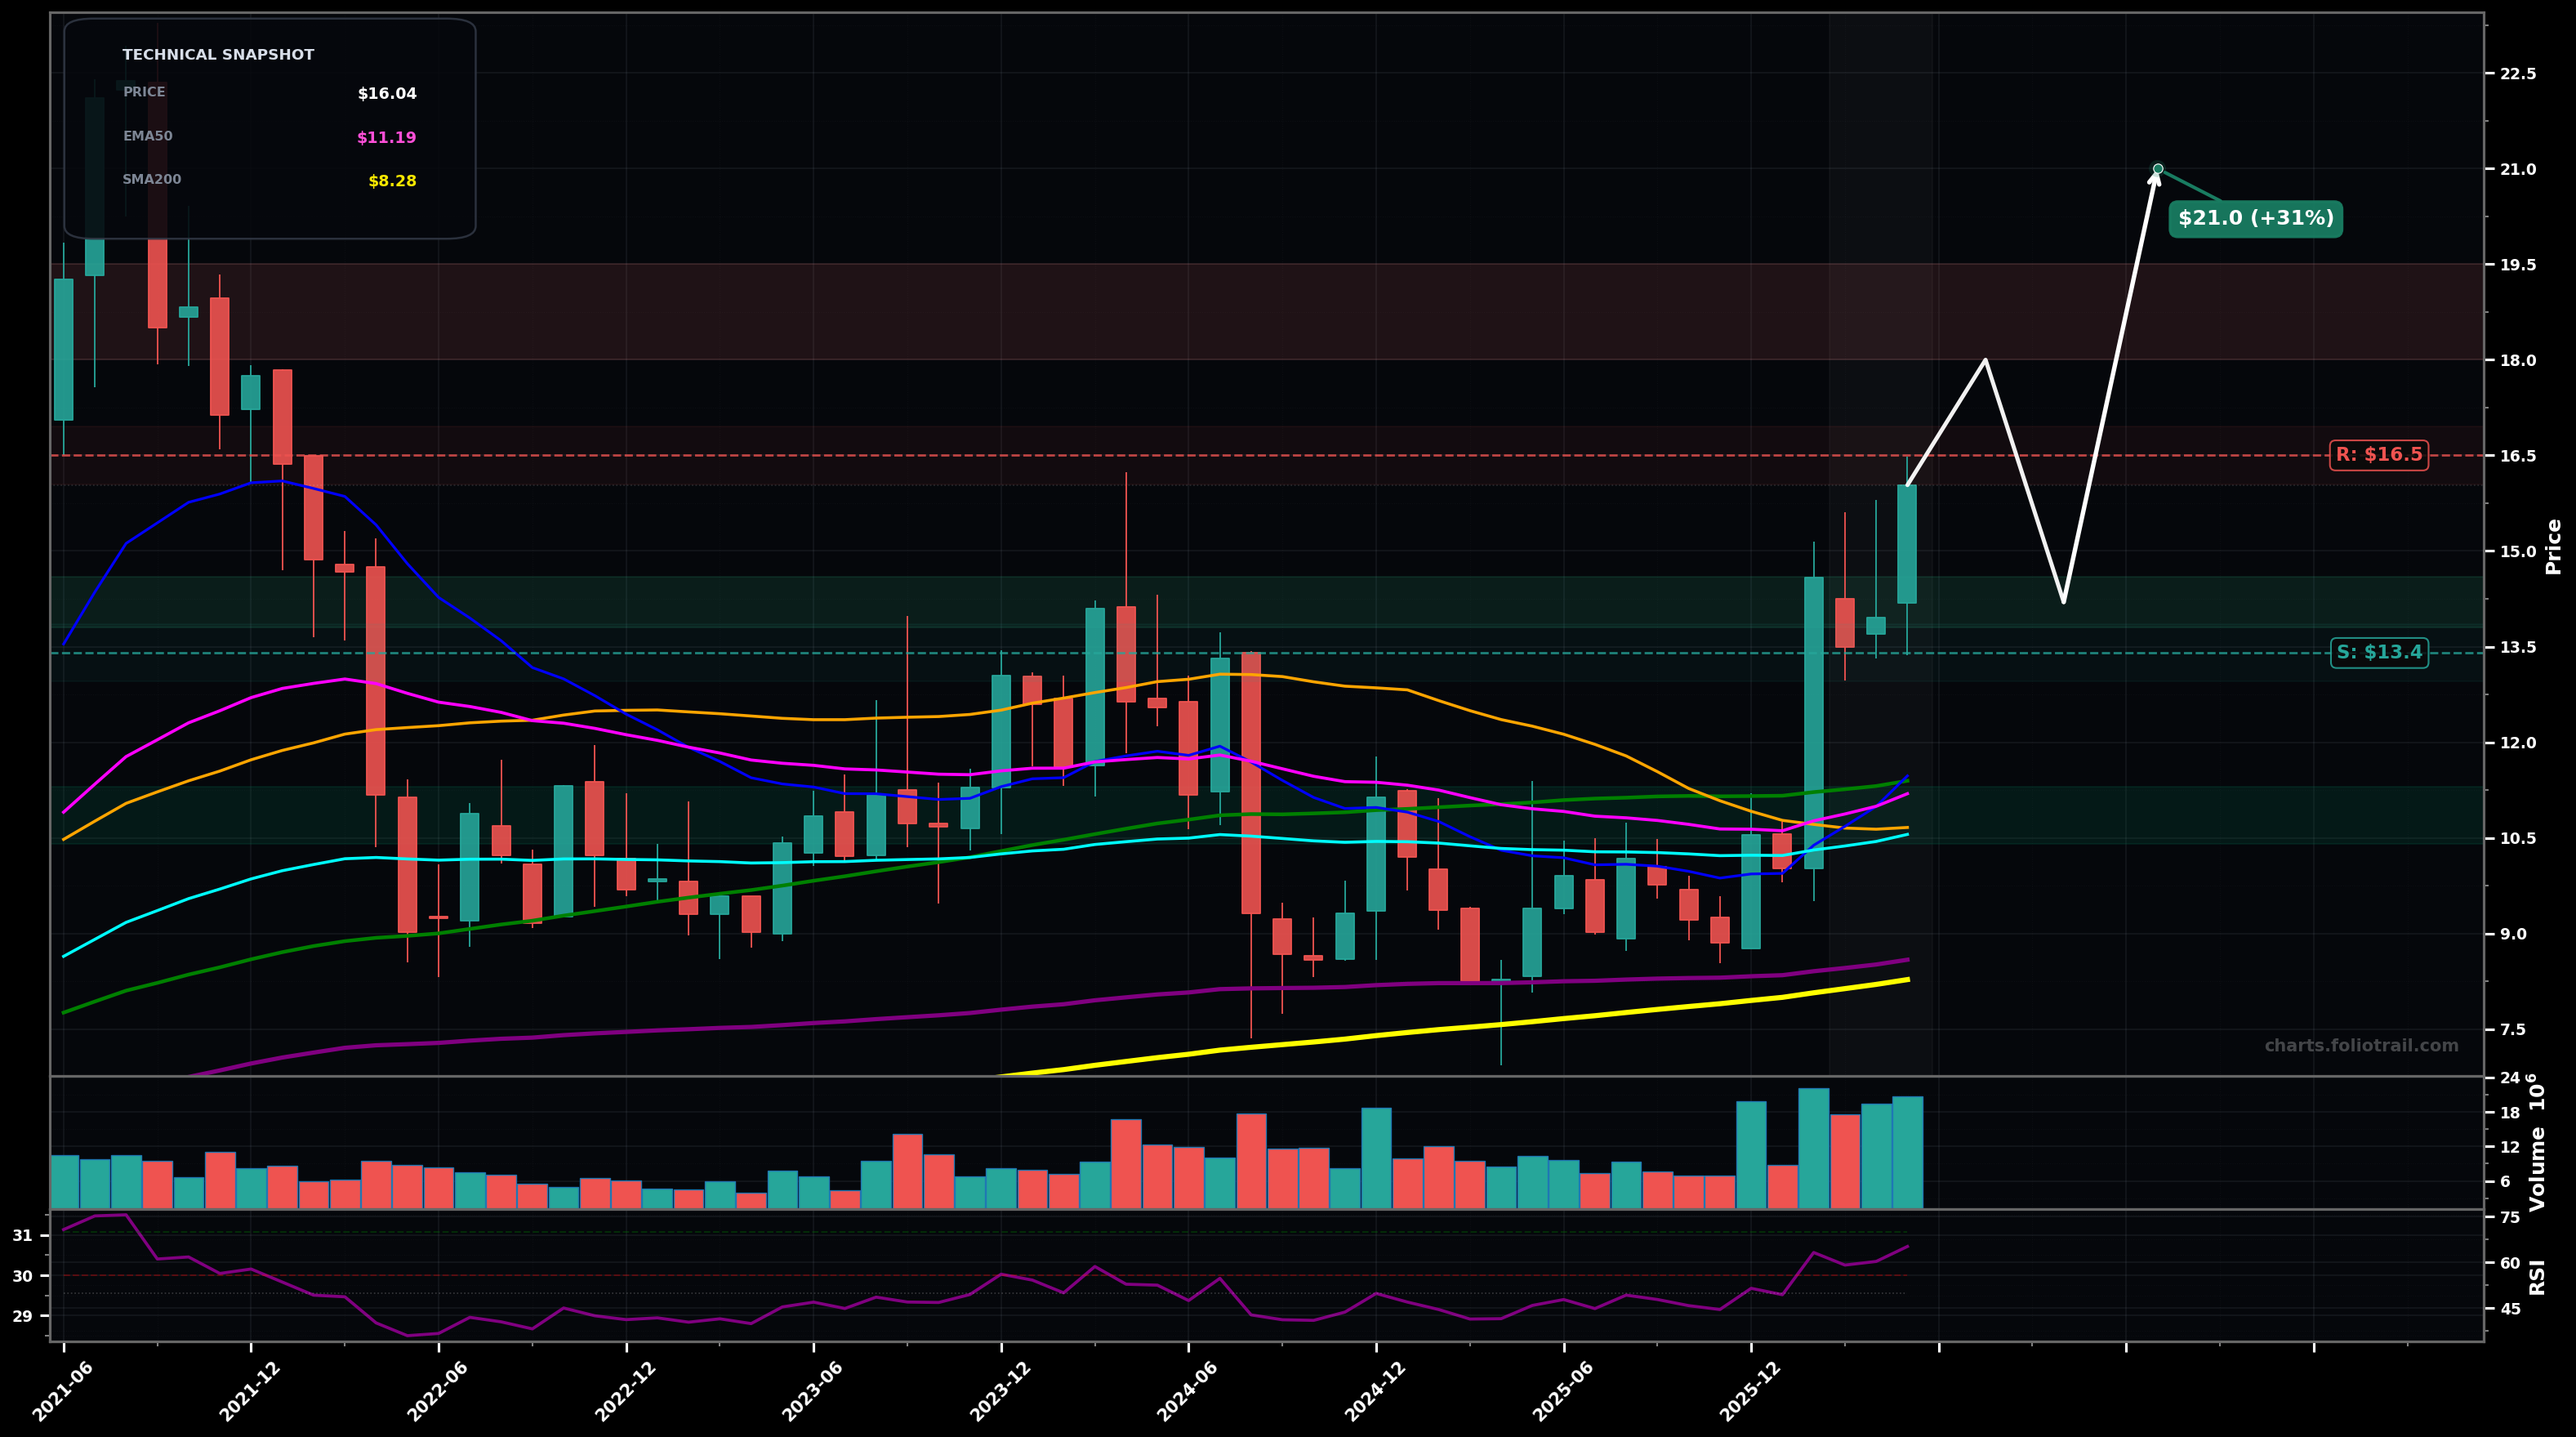
As of May 22, 2026, MITK (Mitek Systems Inc.) is in a breakout reversal state on the monthly chart, with a confidence level of 68%. Key support is at $13.4 and key resistance at $16.5. Monthly breakout with strong green candles and rising volume; price at ~$16.04 is well above EMA50/EMA100 and above the prior range, RSI(14) ~65 (momentum bullish, not extreme).
Bullish continuation: breakout consolidates above the old ceiling (~$13–$14) then pushes to the next fib/structure resistance; Elliott view: likely impulsive advance (wave 3) underway after a base, with a shallow wave 4 pullback possible before another leg up.
Bearish pullback / failed breakout: price rejects near ~$16.5–$18 and mean-reverts toward reclaimed MAs (EMA50/EMA100 zone); Elliott view: current push could be a wave C of an A-B-C from the base, followed by a deeper retrace.
Monthly close above $16.50 (breaks the recent swing high and sustains breakout momentum).
Monthly close below $11.20 (back under EMA50 and into the prior base = failed breakout risk).
Buy-the-retest framework: first interest at prior breakout/retest zone (~$14), add if pullback reaches structural support (~$12–$13), heavy add near EMA50/EMA100 confluence and prior base top (~$10.5–$11.3).
Trim into strength at major round-number/structure resistances aligned with likely fib extensions from the base; fully close if price becomes markedly stretched above all key MAs and approaches the upper extension band (~$25+).
As of May 22, 2026, MITK (Mitek Systems Inc.) is in a breakout reversal state on the monthly chart with 68% confidence. Monthly breakout with strong green candles and rising volume; price at ~$16.04 is well above EMA50/EMA100 and above the prior range, RSI(14) ~65 (momentum bullish, not extreme).
On the monthly timeframe, MITK has key support at $13.4 and key resistance at $16.5. The most likely scenario (bullish) targets $18.0 and $21.0, with a revert level at $14.2.
MITK (Mitek Systems Inc.) is currently classified as breakout reversal on the monthly chart, with 68% confidence. Confirmation requires: Monthly close above $16.50 (breaks the recent swing high and sustains breakout momentum). This would be invalidated by: Monthly close below $11.20 (back under EMA50 and into the prior base = failed breakout risk).
The most likely scenario (bullish) targets $18.0 and $21.0, with a revert level at $14.2. The alternative scenario (bearish) targets $12.0 and $10.6.
Multi-layer AI agents analyse 200+ stocks across daily, weekly, and monthly timeframes — producing market state classifications, price scenarios with targets, and position entry/exit levels. Daily charts updated every trading day at 6 PM ET. Weekly charts refresh Fridays. Monthly charts refresh on the last trading day of each month. No paywall. No sign-up required.
Built by Foliotrail.
All content on this website — including charts, analysis, price targets, support/resistance levels, and position zones — is generated entirely by AI and provided for educational and informational purposes only.
This is not financial advice. NEXUSNOIR VENTURES SL (the operator of this website) is not a registered investment adviser or broker-dealer. You should not make investment decisions based solely on this information. Always do your own research and consult a qualified financial advisor.
By continuing, you acknowledge that you have read and agree to our full disclaimer & terms of use and privacy policy.