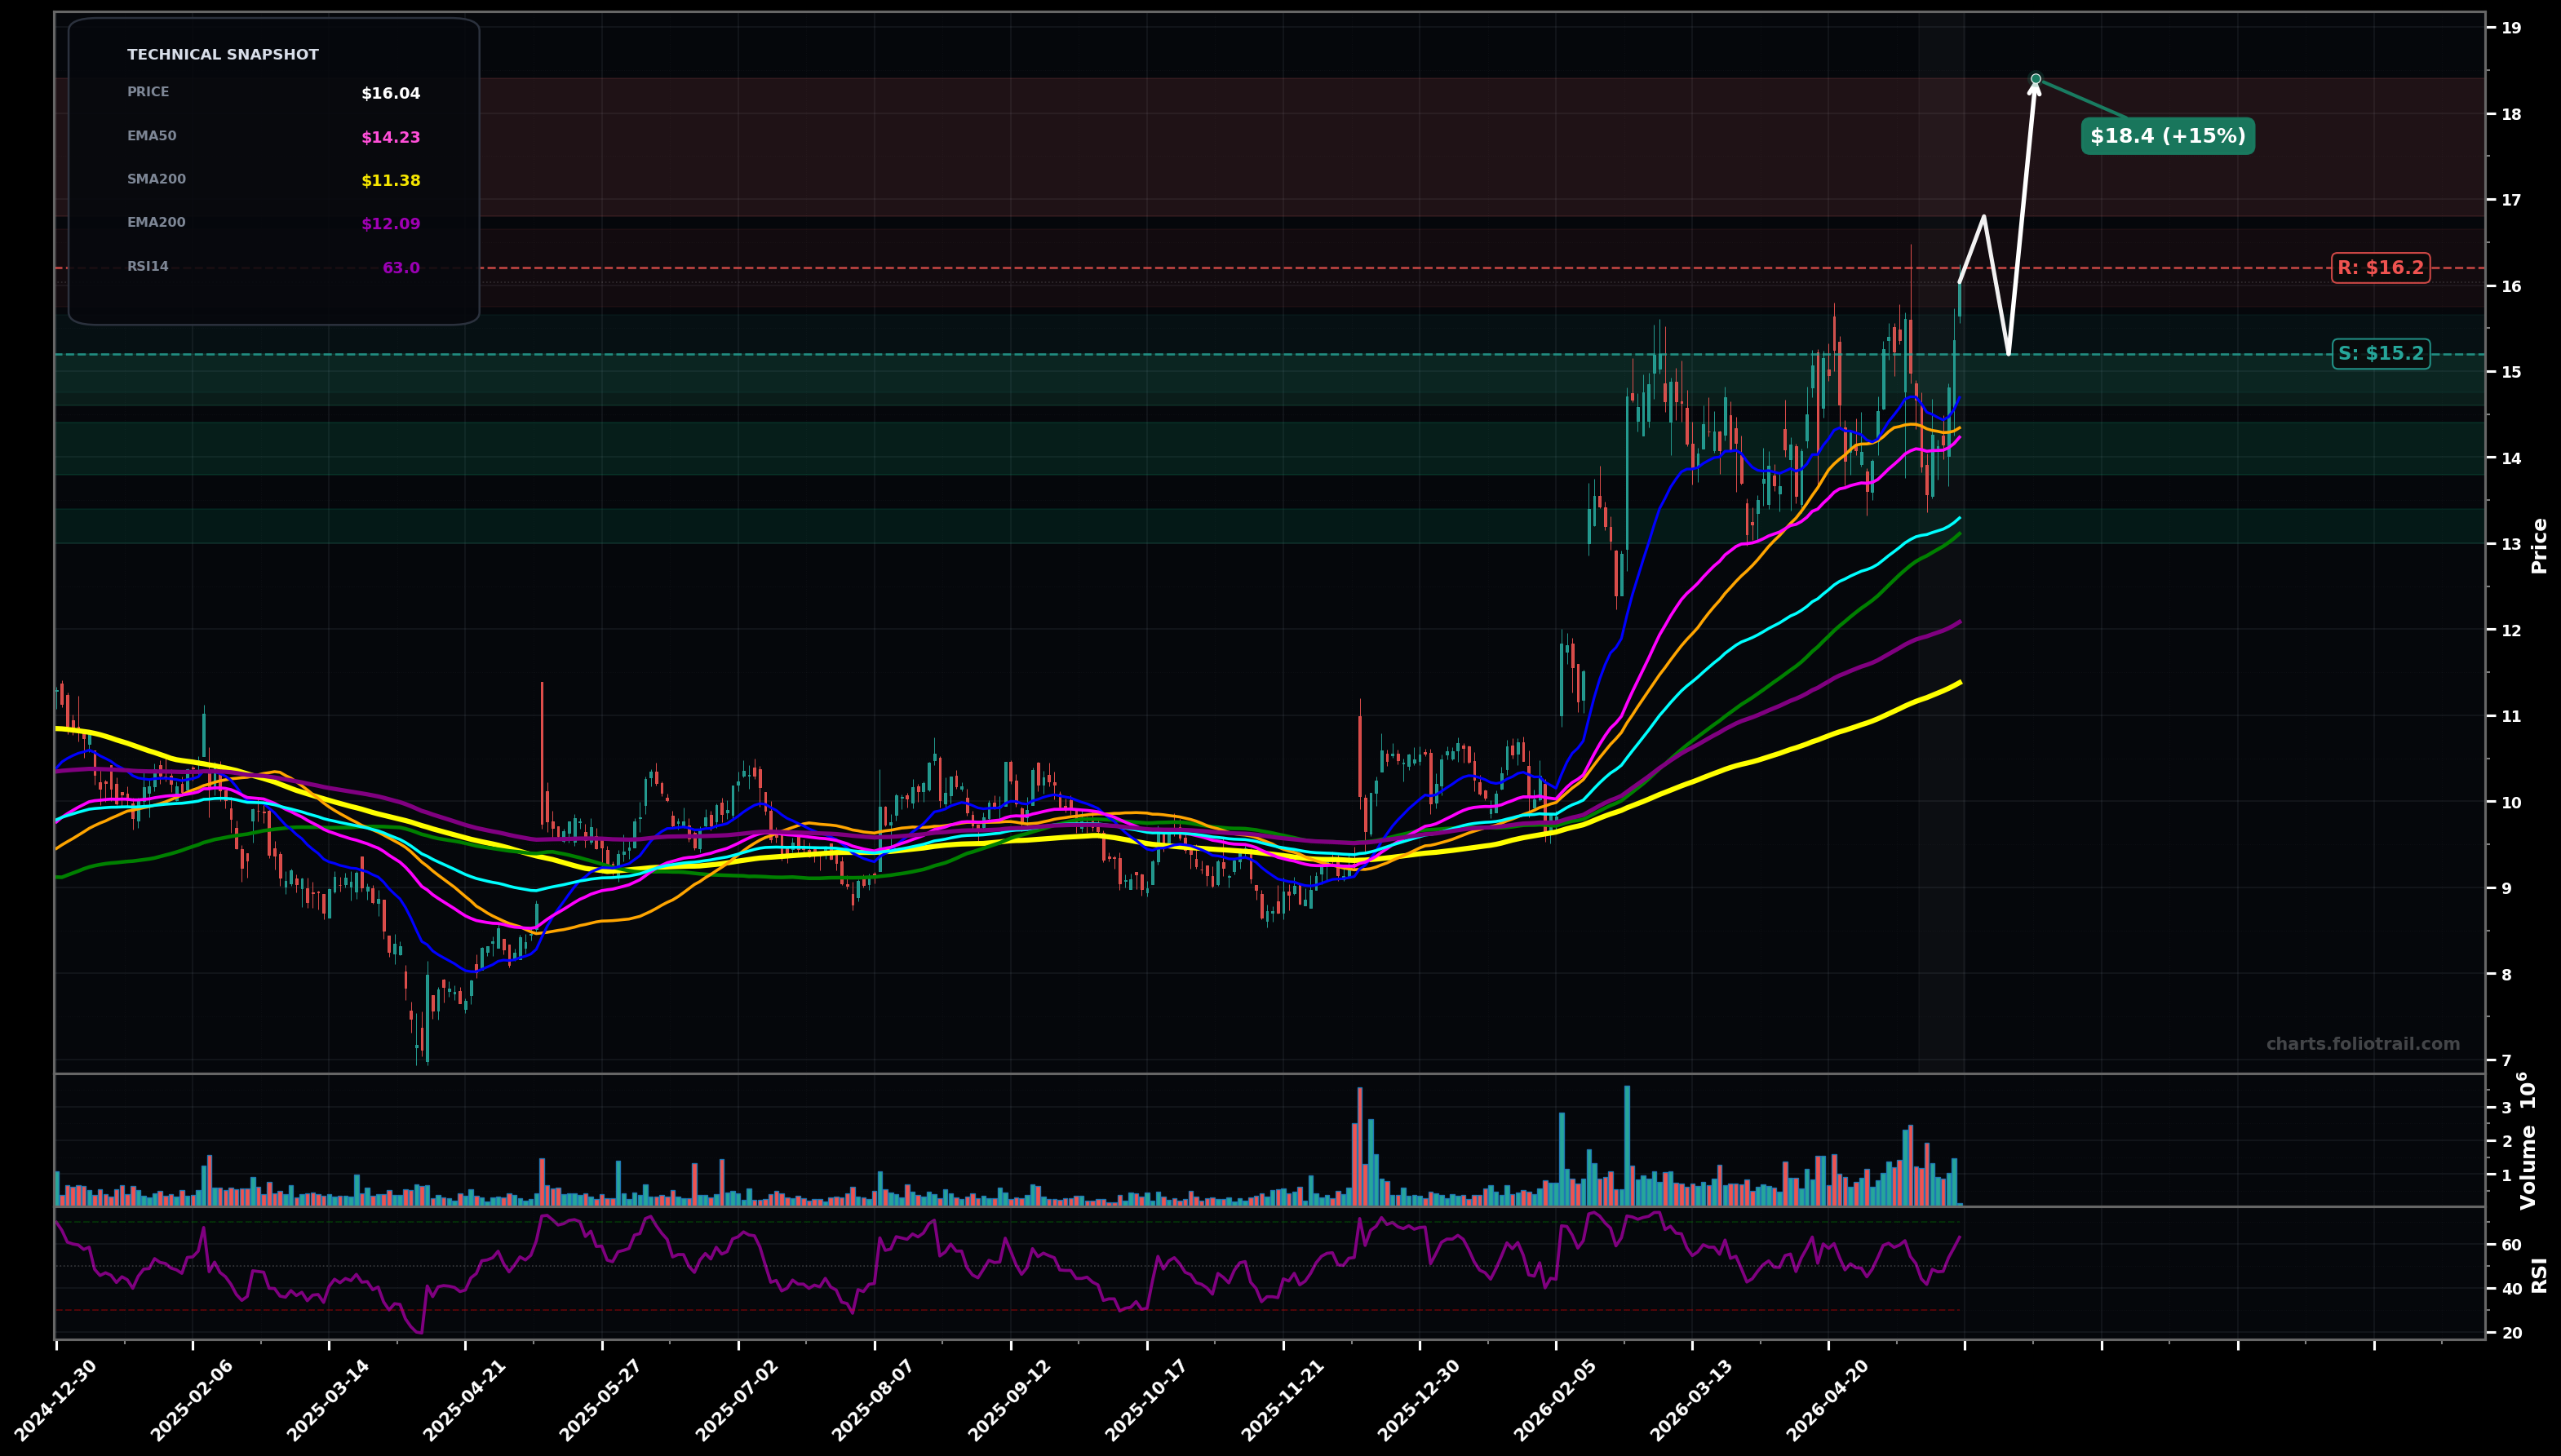
As of May 22, 2026, MITK (Mitek Systems Inc.) is in a uptrend state on the daily chart, with a confidence level of 72%. Key support is at $15.2 and key resistance at $16.2. Price at ~$16.04 made a fresh breakout to new swing highs with strong momentum; holding well above rising EMA50/EMA100 and all key SMAs.
Continuation: brief consolidation/pullback into ~$15.20 then push to new highs (likely Wave 5 extension after a Wave 4-style sideways pullback).
Deeper mean-reversion: rejection near ~$16.20 and drop toward the rising EMA50/cluster support; if that holds, attempt a higher low base and re-break.
2+ daily closes holding above ~$15.20
Daily close below ~$14.20
Buy-the-dip zones align with prior breakout area + EMA50 (~$14.2) then EMA100 (~$13.3); heavy add only if price resets to deeper trend support while keeping a larger uptrend intact.
Trim into Fibonacci-style extensions above the prior swing base and as price stretches far above EMA50/EMA100 (parabolic risk); fully exit only if a major multi-year extension/overheat move prints.
As of May 22, 2026, MITK (Mitek Systems Inc.) is in a uptrend state on the daily chart with 72% confidence. Price at ~$16.04 made a fresh breakout to new swing highs with strong momentum; holding well above rising EMA50/EMA100 and all key SMAs.
On the daily timeframe, MITK has key support at $15.2 and key resistance at $16.2. The most likely scenario (bullish) targets $16.8 and $18.4, with a revert level at $15.2.
MITK (Mitek Systems Inc.) is currently classified as uptrend on the daily chart, with 72% confidence. Confirmation requires: 2+ daily closes holding above ~$15.20 This would be invalidated by: Daily close below ~$14.20
The most likely scenario (bullish) targets $16.8 and $18.4, with a revert level at $15.2. The alternative scenario (bearish) targets $14.2 and $13.3.
Multi-layer AI agents analyse 200+ stocks across daily, weekly, and monthly timeframes — producing market state classifications, price scenarios with targets, and position entry/exit levels. Daily charts updated every trading day at 6 PM ET. Weekly charts refresh Fridays. Monthly charts refresh on the last trading day of each month. No paywall. No sign-up required.
Built by Foliotrail.
All content on this website — including charts, analysis, price targets, support/resistance levels, and position zones — is generated entirely by AI and provided for educational and informational purposes only.
This is not financial advice. NEXUSNOIR VENTURES SL (the operator of this website) is not a registered investment adviser or broker-dealer. You should not make investment decisions based solely on this information. Always do your own research and consult a qualified financial advisor.
By continuing, you acknowledge that you have read and agree to our full disclaimer & terms of use and privacy policy.