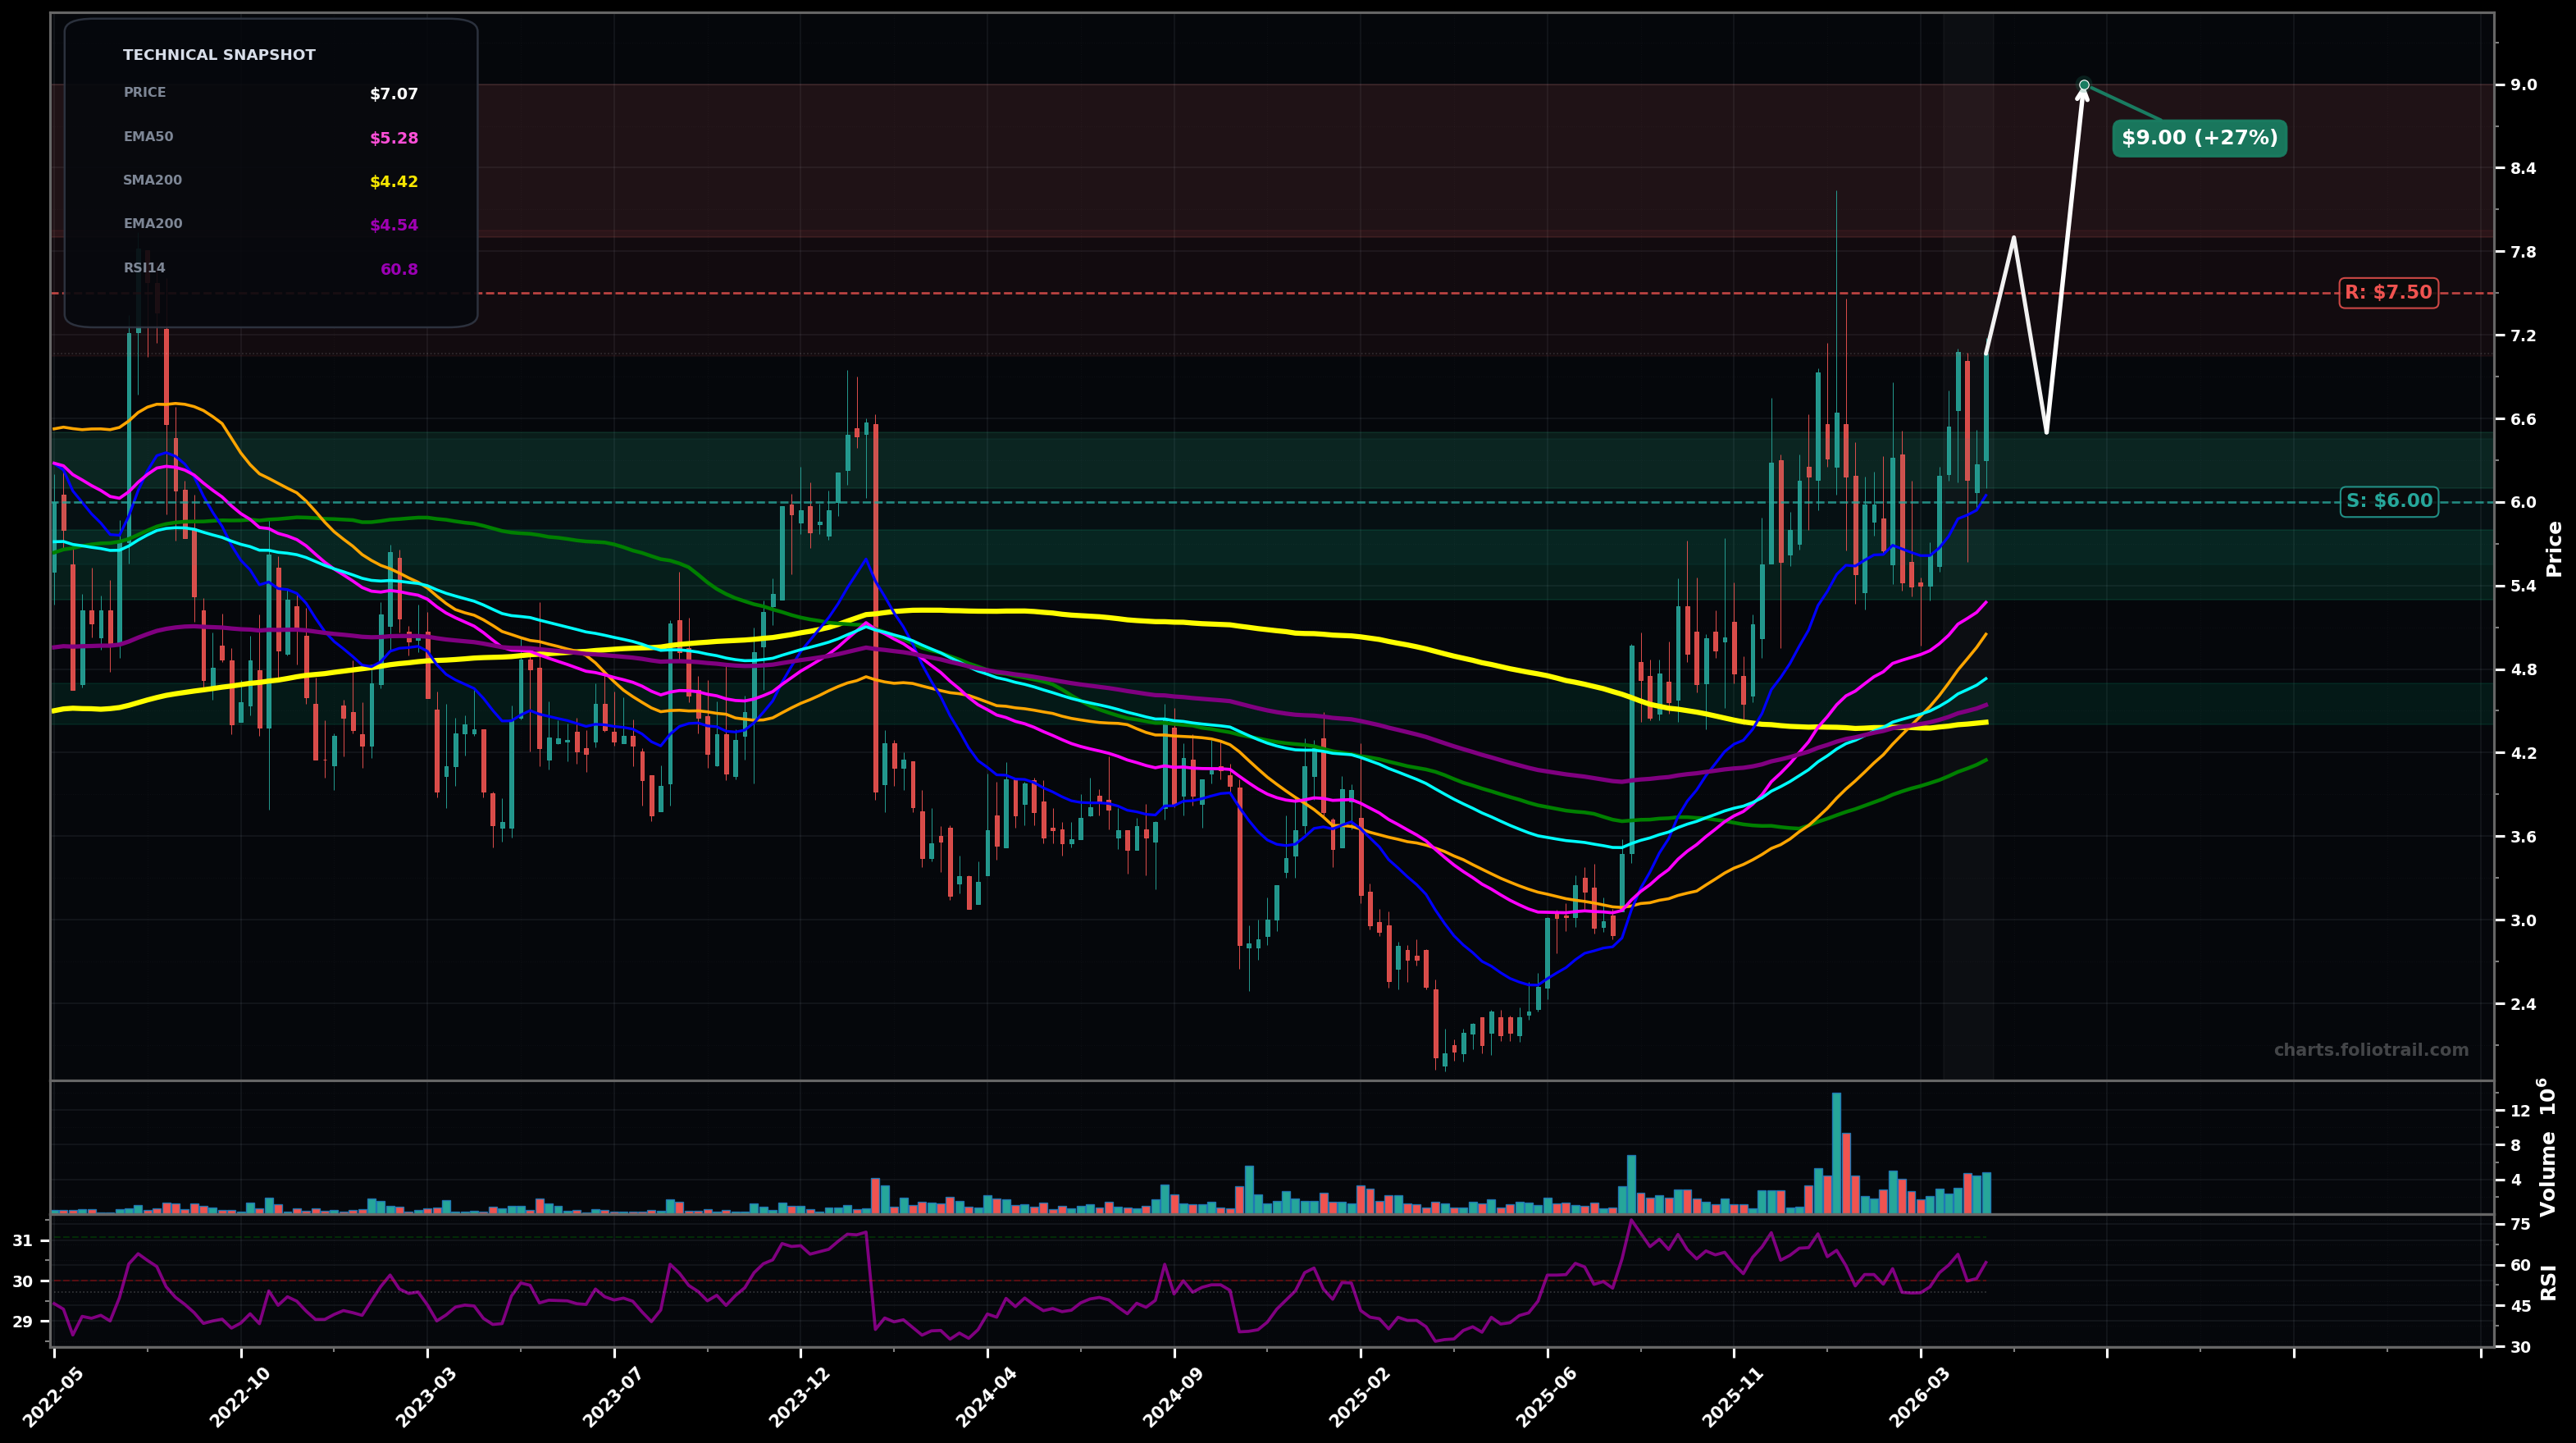
As of May 22, 2026, LTRX (Lantronix Inc.) is in a uptrend state on the weekly chart, with a confidence level of 67%. Key support is at $6.00 and key resistance at $7.50. Weekly up-move holds above rising EMA50 (~$5.28) after a pullback; price ~$7.07 is consolidating below prior swing-high resistance around the $7.2–$7.5 zone with RSI ~60.
Bullish continuation: consolidation resolves higher; a break above the $7.2–$7.5 swing-high area triggers the next leg up (Elliott view: likely wave 5 extension after wave 4 chop).
Bearish pullback within uptrend: price fails at ~$7.5 and mean-reverts to rising averages (EMA20/EMA50) for a higher-low; this would be a wave-4/ABC style retrace before any new attempt higher.
2+ weekly closes above $7.50
Weekly close below $5.25
Start near former breakout/retest ($6s); add on EMA50/pivot support (~$5.3–$5.8); heavy add only on deep retrace into EMA200/SMA200 confluence (~$4.4–$4.7).
Trim into prior-high/extension zones after a multi-month run (likely fib extensions of the ~$2→$7 impulse); larger trims if price gets far stretched above EMA50/EMA100, full exit only on extreme multi-year extension.
As of May 22, 2026, LTRX (Lantronix Inc.) is in a uptrend state on the weekly chart with 67% confidence. Weekly up-move holds above rising EMA50 (~$5.28) after a pullback; price ~$7.07 is consolidating below prior swing-high resistance around the $7.2–$7.5 zone with RSI ~60.
On the weekly timeframe, LTRX has key support at $6.00 and key resistance at $7.50. The most likely scenario (bullish) targets $7.90 and $9.00, with a revert level at $6.50.
LTRX (Lantronix Inc.) is currently classified as uptrend on the weekly chart, with 67% confidence. Confirmation requires: 2+ weekly closes above $7.50 This would be invalidated by: Weekly close below $5.25
The most likely scenario (bullish) targets $7.90 and $9.00, with a revert level at $6.50. The alternative scenario (bearish) targets $6.00 and $5.30.
Multi-layer AI agents analyse 200+ stocks across daily, weekly, and monthly timeframes — producing market state classifications, price scenarios with targets, and position entry/exit levels. Daily charts updated every trading day at 6 PM ET. Weekly charts refresh Fridays. Monthly charts refresh on the last trading day of each month. No paywall. No sign-up required.
Built by Foliotrail.
All content on this website — including charts, analysis, price targets, support/resistance levels, and position zones — is generated entirely by AI and provided for educational and informational purposes only.
This is not financial advice. NEXUSNOIR VENTURES SL (the operator of this website) is not a registered investment adviser or broker-dealer. You should not make investment decisions based solely on this information. Always do your own research and consult a qualified financial advisor.
By continuing, you acknowledge that you have read and agree to our full disclaimer & terms of use and privacy policy.