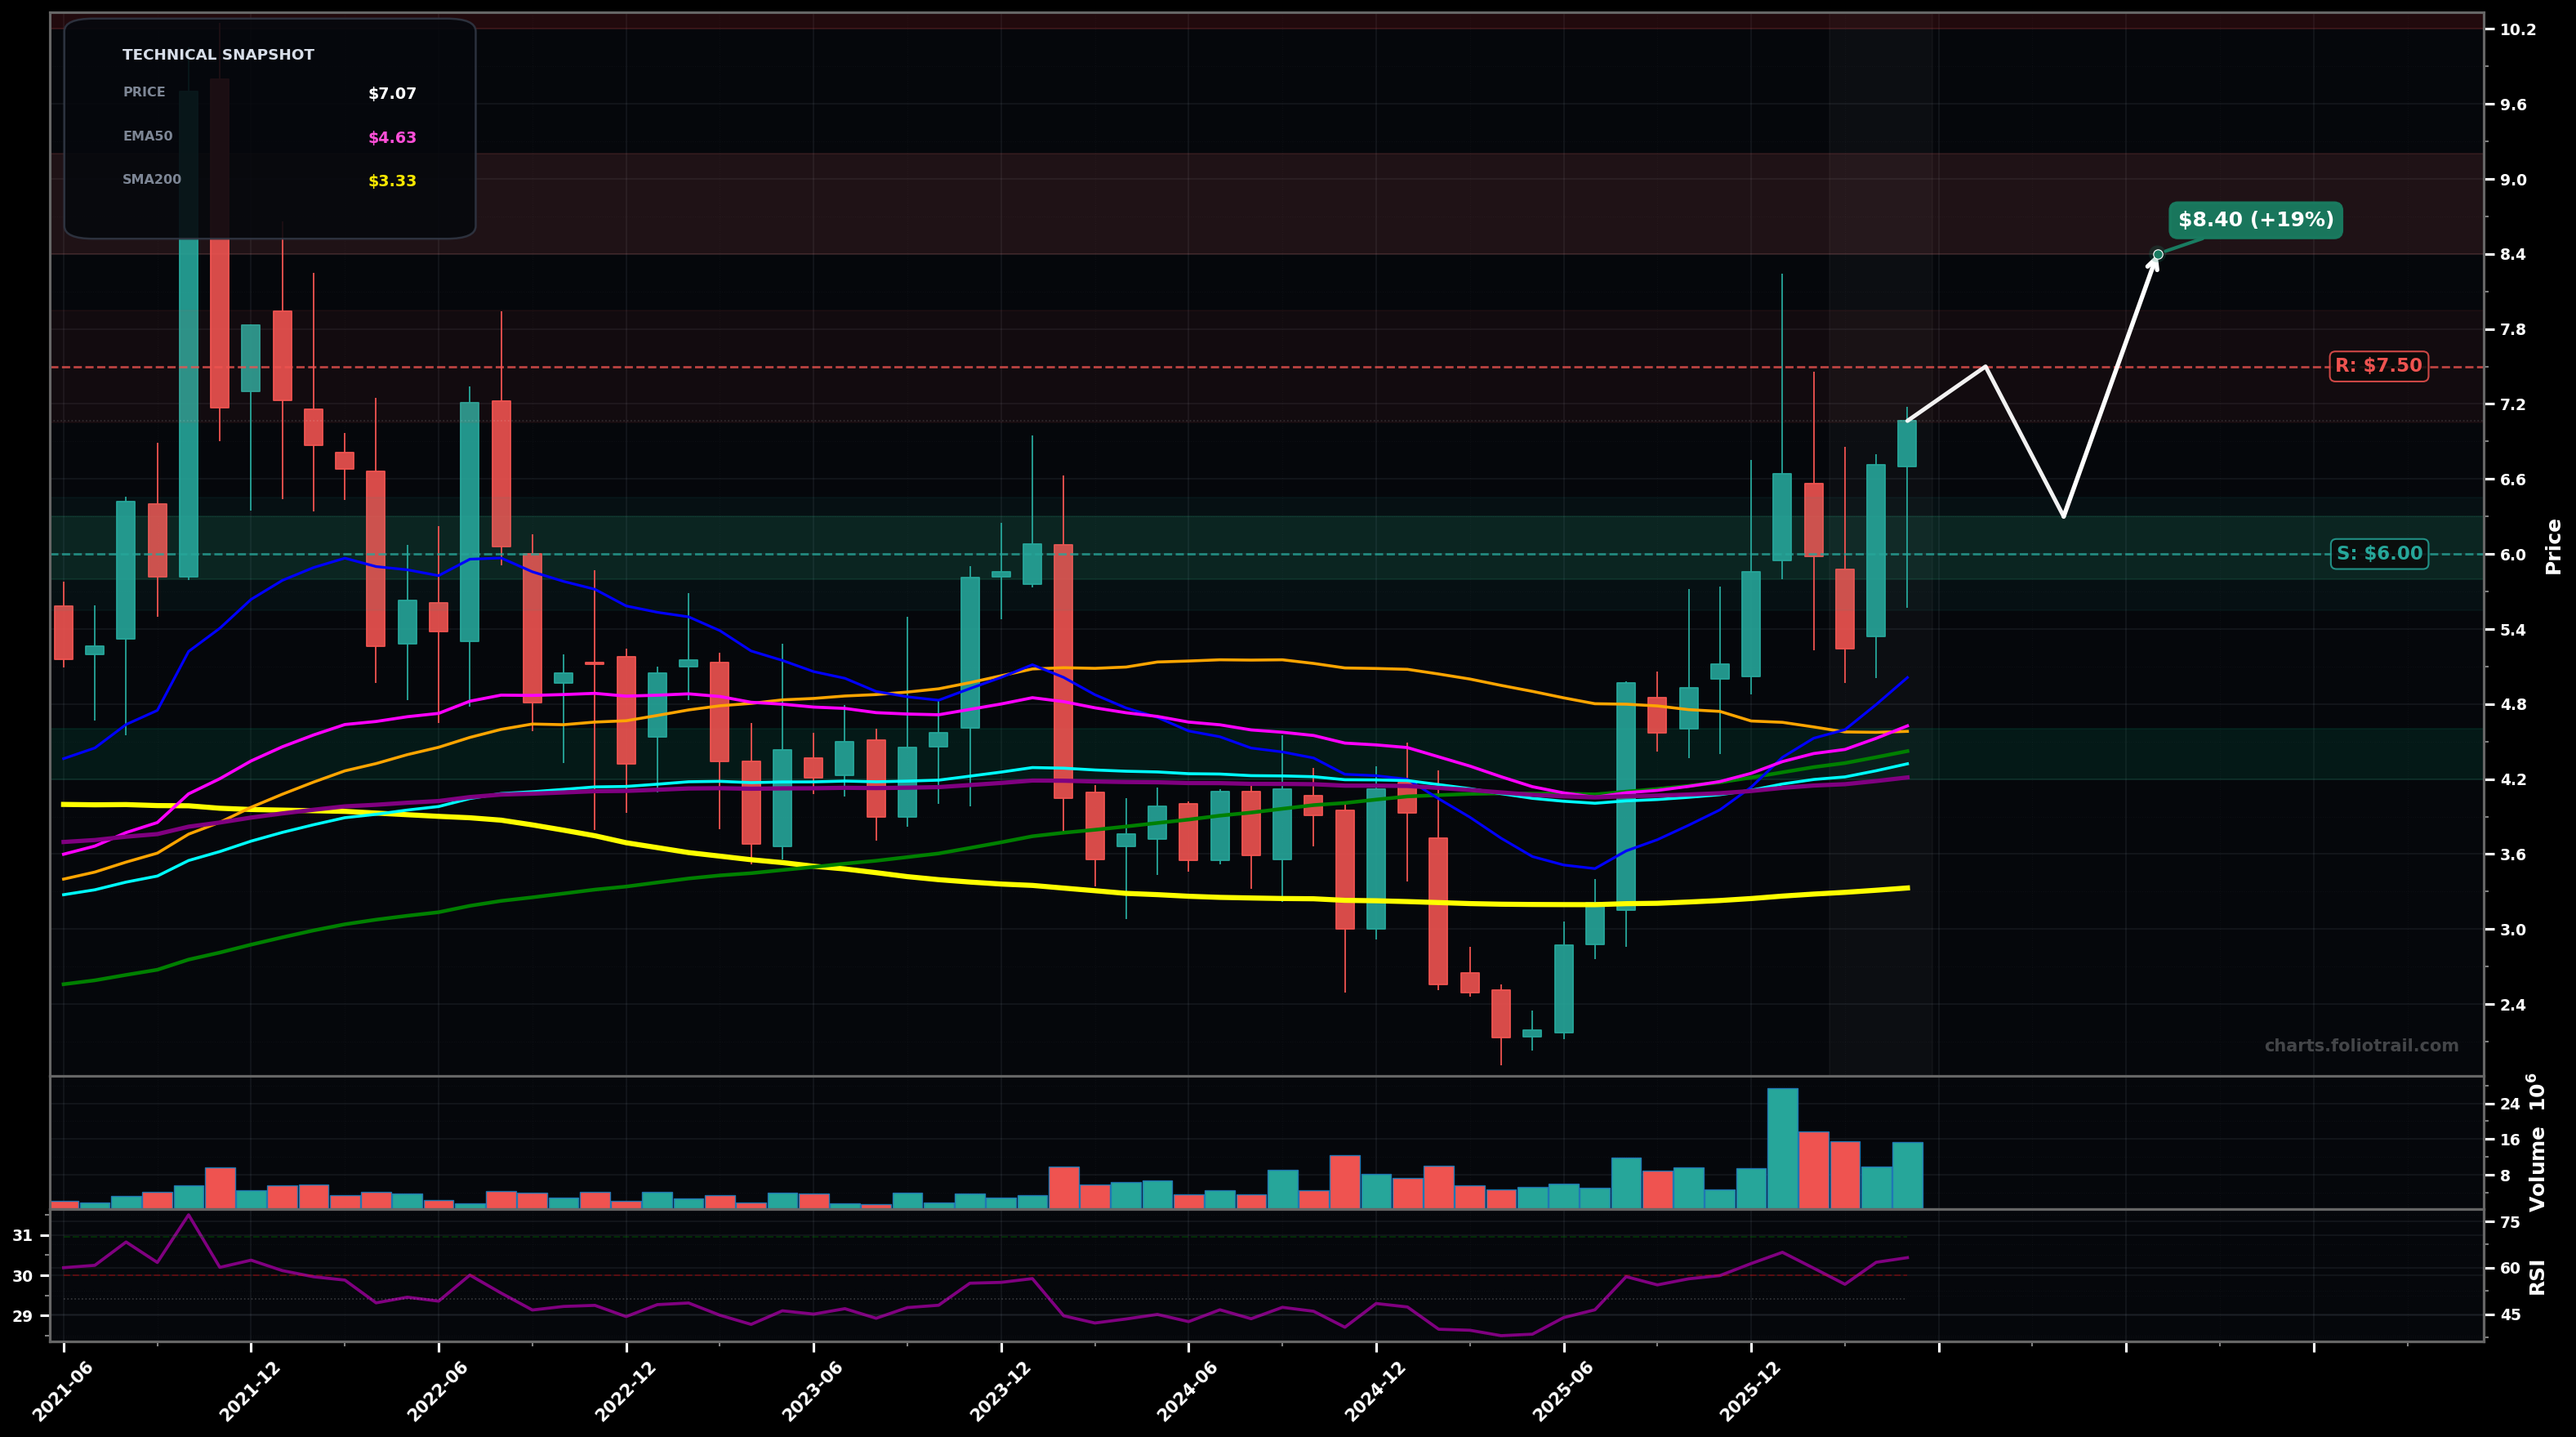
As of May 22, 2026, LTRX (Lantronix Inc.) is in a breakout reversal state on the monthly chart, with a confidence level of 72%. Key support is at $6.00 and key resistance at $7.50. Strong multi-month rally off the 2025 low; price now at $7.07, extended above all major MAs with RSI ~63 and elevated volume; recent candles show pullback then re-acceleration.
Bullish continuation: price consolidates above ~$6.00 then pushes through the $7.50 area (prior supply) to test the next fib/structural zone; Elliott view: advance from ~$2.2 looks like an impulsive Wave 3 with a shallow Wave 4 consolidation likely before another push.
Deeper pullback/retest: failed breakout at ~$7.50 leads to a larger Wave 4-style retrace toward the MA cluster (EMA100/EMA200/SMA100 area) before attempting another base-and-break; risk increases if a monthly candle prints a large red close near lows.
Monthly close above $7.20 (holds the breakout zone) with no loss of EMA50 ($4.63) on the next pullback.
Monthly close below $4.60 (loss of EMA50/SMA50 area) would shift back toward base-failure risk.
Start on a successful retest/hold of the $6 area; add into a pullback toward prior breakout/structure; heavy add near the confluence of EMA200 (~$4.21) + EMA100/SMA100 (~$4.3–$4.4) where a Wave-4 low is plausible.
Trim into strength at prior multi-year resistance/fib extension zones (momentum likely to cool); progressively derisk if price becomes far stretched above EMA50/100 on monthly closes and RSI pushes into overbought territory.
As of May 22, 2026, LTRX (Lantronix Inc.) is in a breakout reversal state on the monthly chart with 72% confidence. Strong multi-month rally off the 2025 low; price now at $7.07, extended above all major MAs with RSI ~63 and elevated volume; recent candles show pullback then re-acceleration.
On the monthly timeframe, LTRX has key support at $6.00 and key resistance at $7.50. The most likely scenario (bullish) targets $7.50 and $8.40, with a revert level at $6.30.
LTRX (Lantronix Inc.) is currently classified as breakout reversal on the monthly chart, with 72% confidence. Confirmation requires: Monthly close above $7.20 (holds the breakout zone) with no loss of EMA50 ($4.63) on the next pullback. This would be invalidated by: Monthly close below $4.60 (loss of EMA50/SMA50 area) would shift back toward base-failure risk.
The most likely scenario (bullish) targets $7.50 and $8.40, with a revert level at $6.30. The alternative scenario (bearish) targets $5.20 and $4.40.
Multi-layer AI agents analyse 200+ stocks across daily, weekly, and monthly timeframes — producing market state classifications, price scenarios with targets, and position entry/exit levels. Daily charts updated every trading day at 6 PM ET. Weekly charts refresh Fridays. Monthly charts refresh on the last trading day of each month. No paywall. No sign-up required.
Built by Foliotrail.
All content on this website — including charts, analysis, price targets, support/resistance levels, and position zones — is generated entirely by AI and provided for educational and informational purposes only.
This is not financial advice. NEXUSNOIR VENTURES SL (the operator of this website) is not a registered investment adviser or broker-dealer. You should not make investment decisions based solely on this information. Always do your own research and consult a qualified financial advisor.
By continuing, you acknowledge that you have read and agree to our full disclaimer & terms of use and privacy policy.