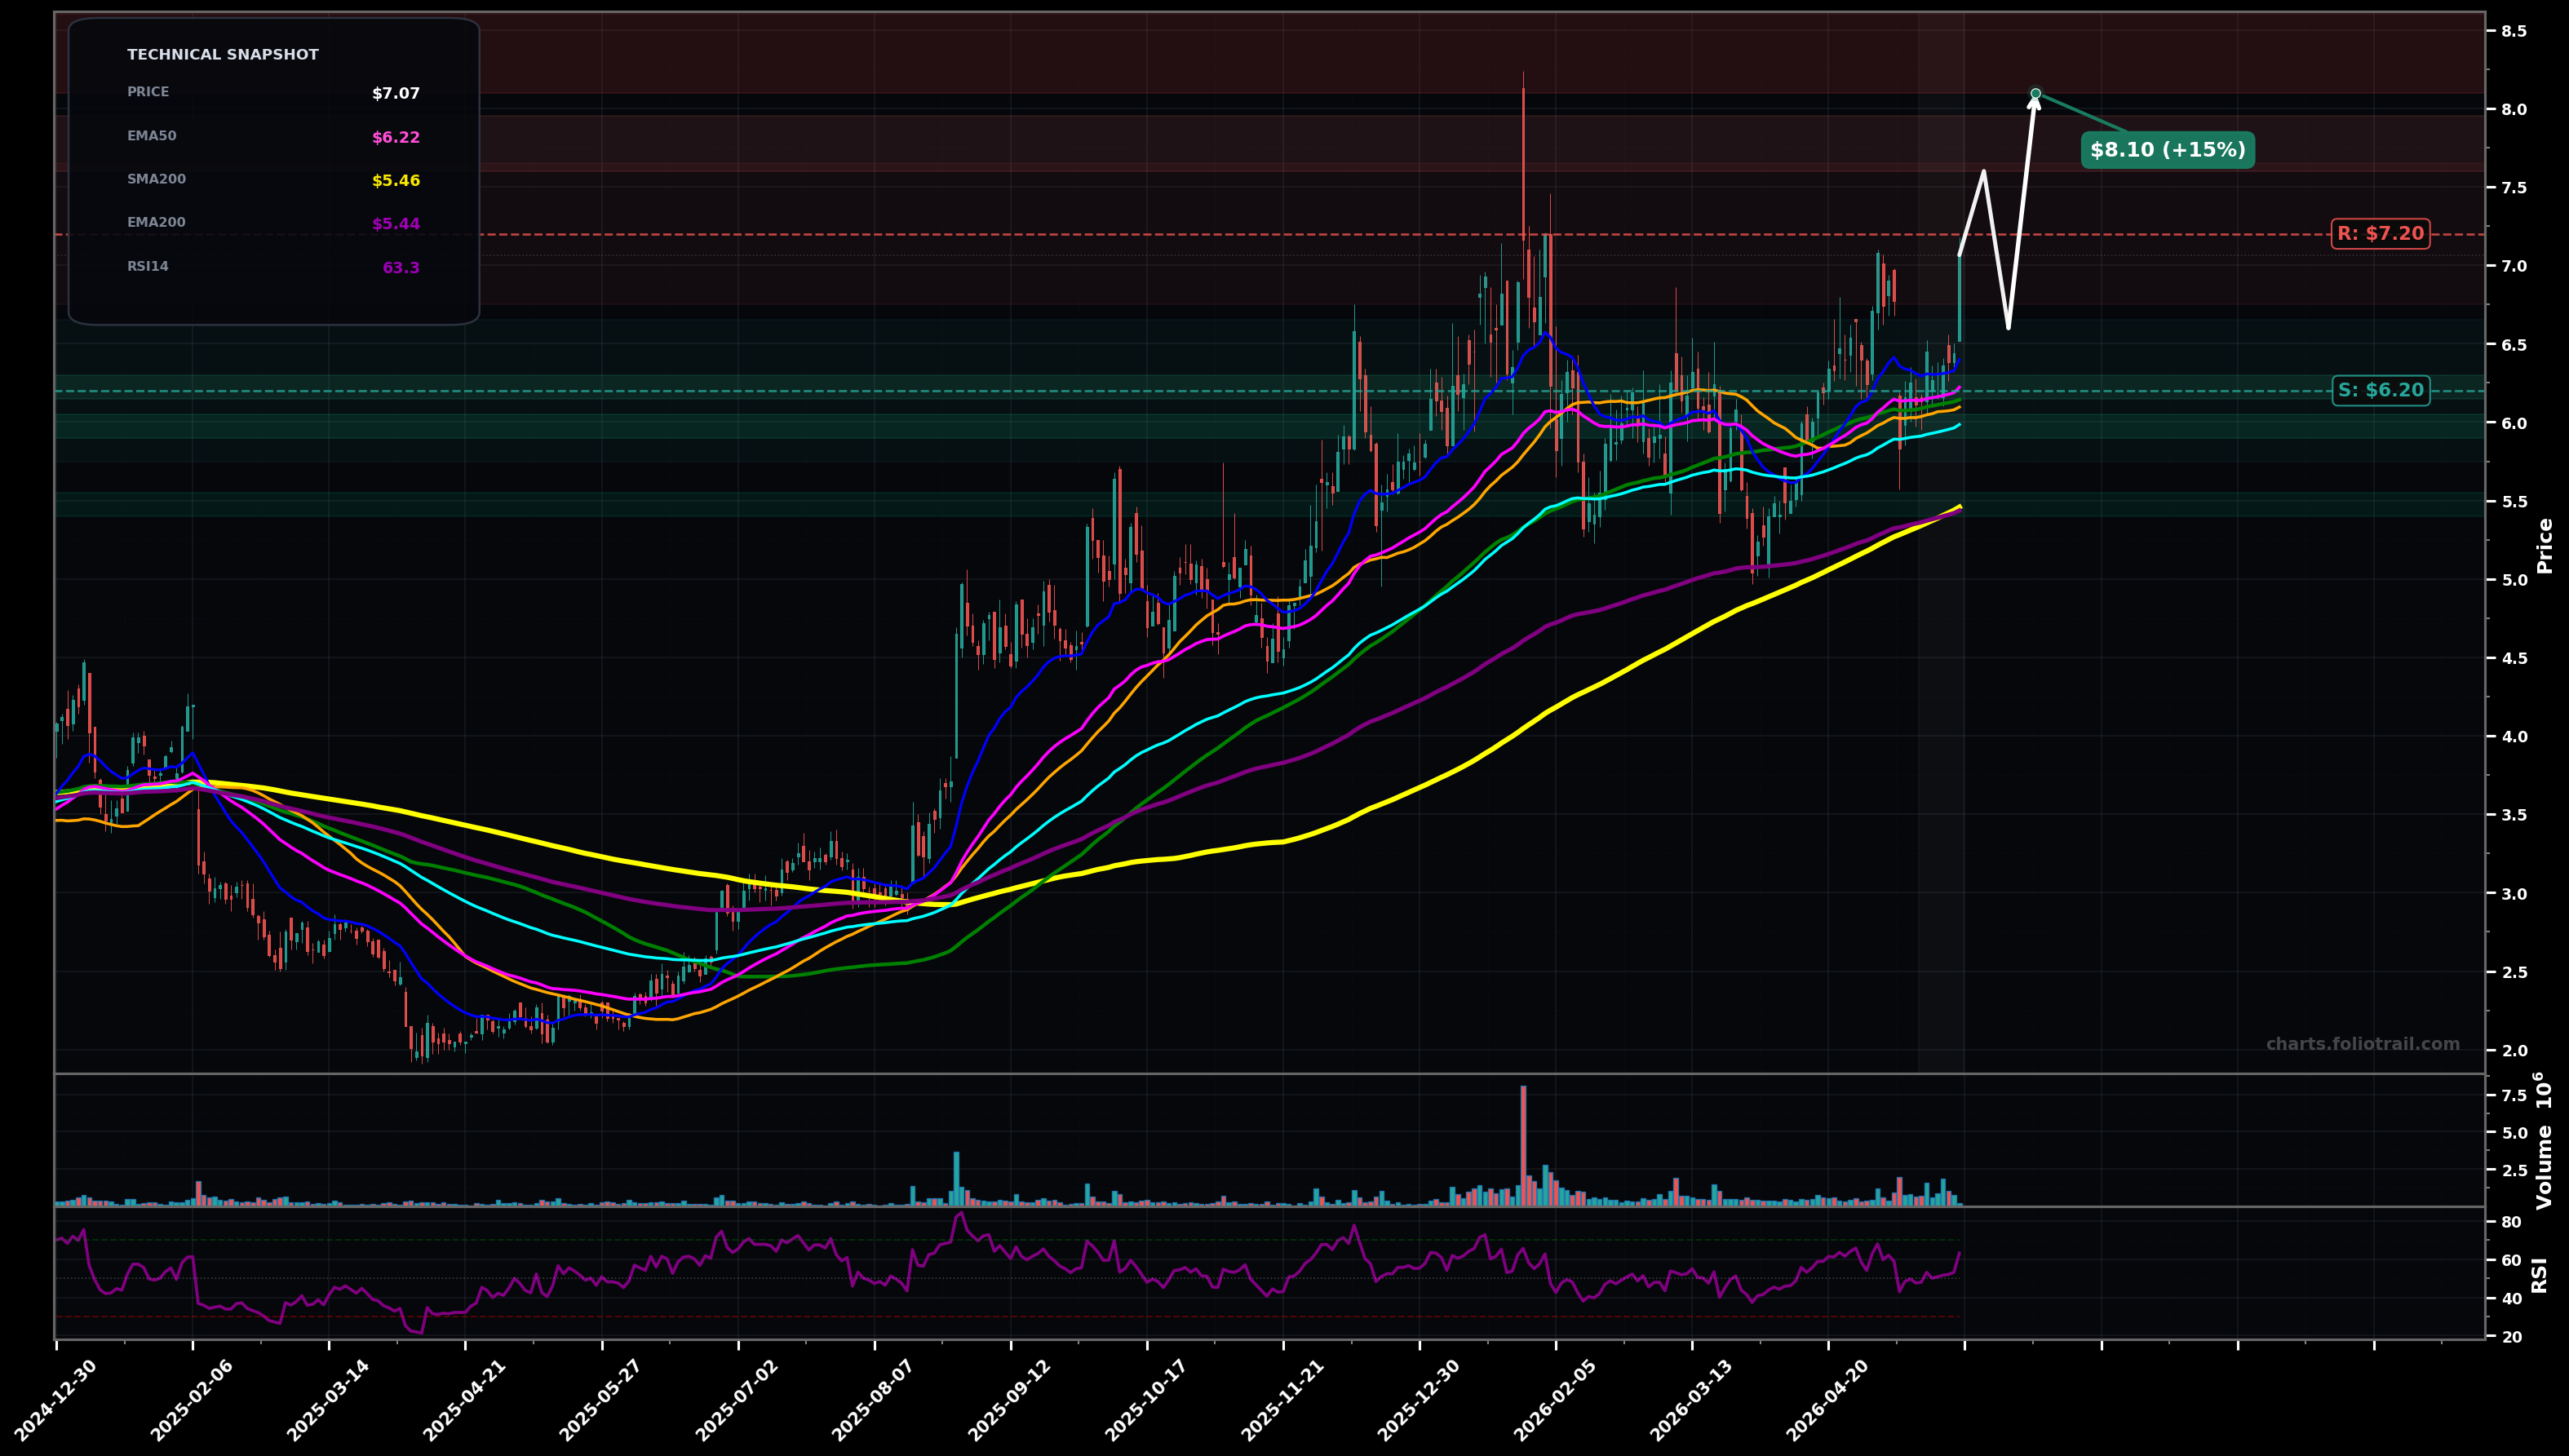
As of May 22, 2026, LTRX (Lantronix Inc.) is in a uptrend state on the daily chart, with a confidence level of 68%. Key support is at $6.20 and key resistance at $7.20. Price ($7.07) pushed to a fresh local high and is holding above the clustered short/mid MAs (SMA50/100 and EMA50/100); momentum healthy (RSI14 ~63).
Bullish continuation: brief consolidation/pullback holds the $6.2 area (EMA50/SMA50 cluster) then breaks $7.20, targeting prior supply near the Jan spike zone and a measured move extension.
Bearish pullback/retest: rejection at $7.2–$7.3 leads to a deeper mean-reversion toward EMA100/SMA100; if that fails, retest of the rising long-term band near the low-$5s.
2+ daily closes above $7.20
Daily close below $6.00
Scale at the EMA50/SMA50+SMA100 confluence ($6.1–$6.2), add on a controlled break/hold near $6.0, and heavy add only at the rising EMA200/SMA200 area (~$5.4–$5.5) where trend support is strongest.
Trim into overhead supply from the prior spike (around $7.6–$8.1), trim more on extension beyond that into likely Fib/psych resistance ($8.1–$8.6), and consider full exit if price enters a blow-off zone ($8.8–$9.5) far above the rising MA stack.
As of May 22, 2026, LTRX (Lantronix Inc.) is in a uptrend state on the daily chart with 68% confidence. Price ($7.07) pushed to a fresh local high and is holding above the clustered short/mid MAs (SMA50/100 and EMA50/100); momentum healthy (RSI14 ~63).
On the daily timeframe, LTRX has key support at $6.20 and key resistance at $7.20. The most likely scenario (bullish) targets $7.60 and $8.10, with a revert level at $6.60.
LTRX (Lantronix Inc.) is currently classified as uptrend on the daily chart, with 68% confidence. Confirmation requires: 2+ daily closes above $7.20 This would be invalidated by: Daily close below $6.00
The most likely scenario (bullish) targets $7.60 and $8.10, with a revert level at $6.60. The alternative scenario (bearish) targets $5.95 and $5.45.
Multi-layer AI agents analyse 200+ stocks across daily, weekly, and monthly timeframes — producing market state classifications, price scenarios with targets, and position entry/exit levels. Daily charts updated every trading day at 6 PM ET. Weekly charts refresh Fridays. Monthly charts refresh on the last trading day of each month. No paywall. No sign-up required.
Built by Foliotrail.
All content on this website — including charts, analysis, price targets, support/resistance levels, and position zones — is generated entirely by AI and provided for educational and informational purposes only.
This is not financial advice. NEXUSNOIR VENTURES SL (the operator of this website) is not a registered investment adviser or broker-dealer. You should not make investment decisions based solely on this information. Always do your own research and consult a qualified financial advisor.
By continuing, you acknowledge that you have read and agree to our full disclaimer & terms of use and privacy policy.