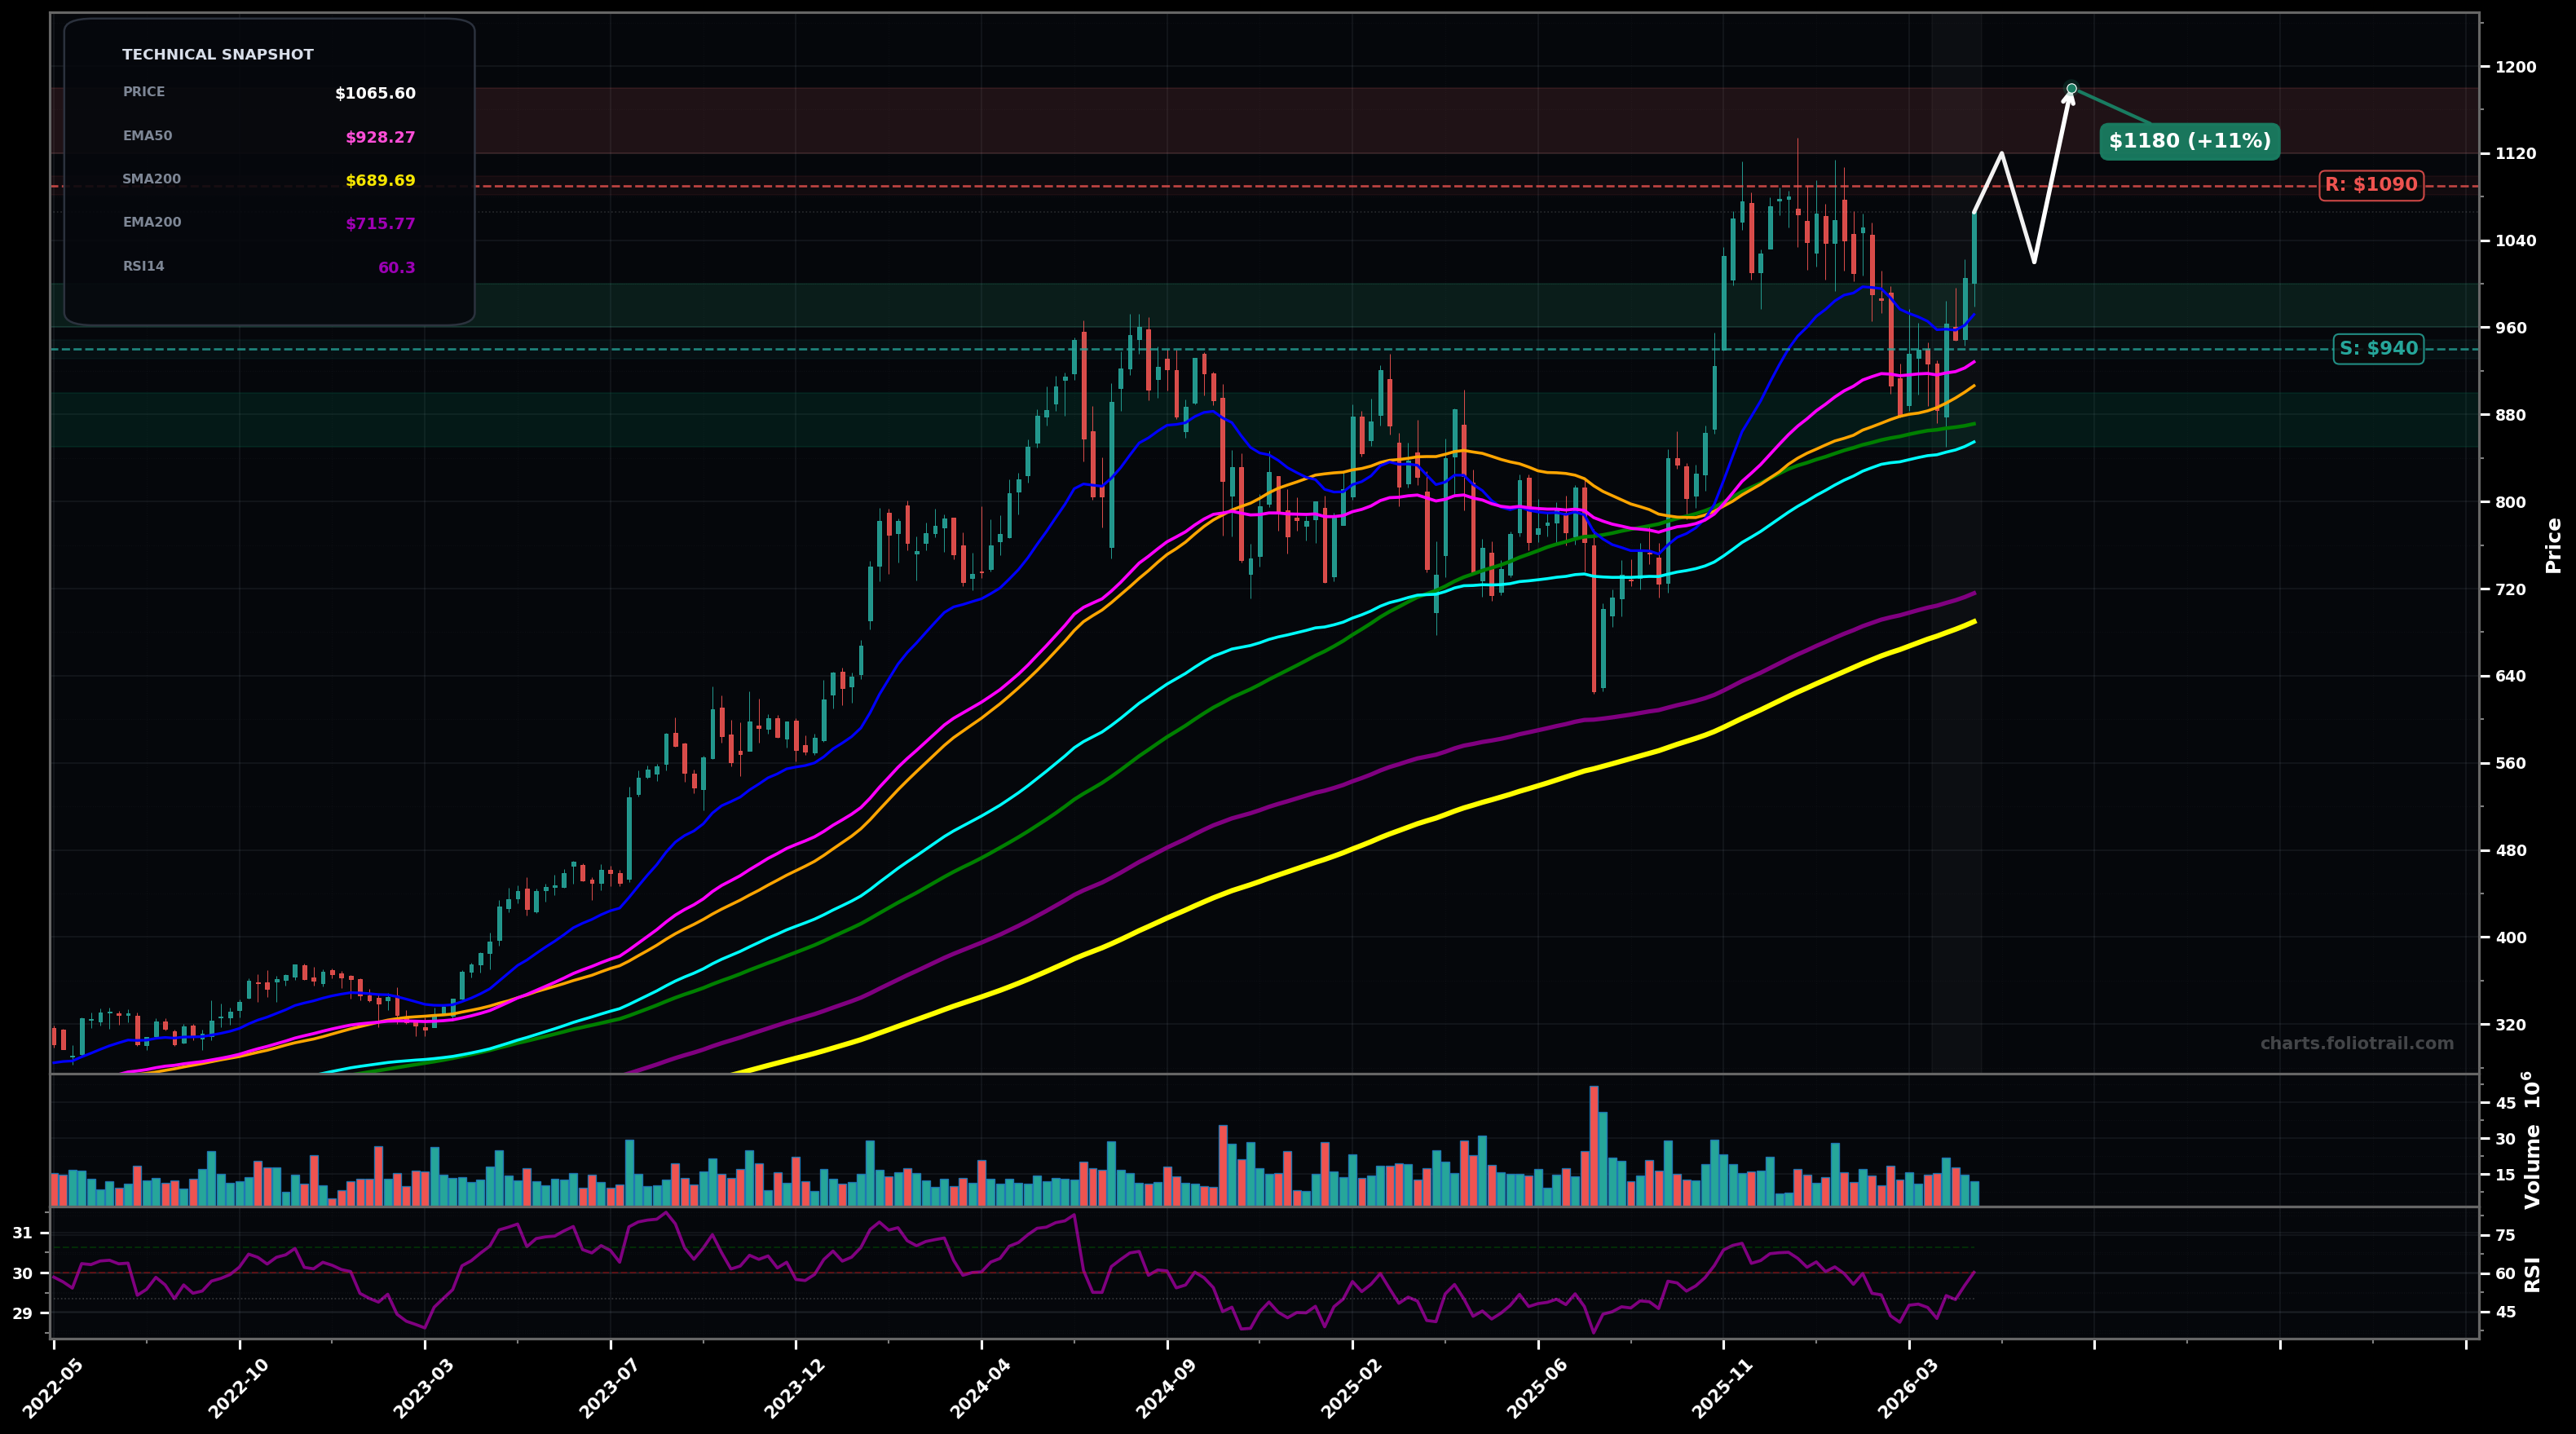
As of May 22, 2026, LLY (Eli Lilly and Company) is in a uptrend state on the weekly chart, with a confidence level of 72%. Key support is at $940 and key resistance at $1090. Weekly bounce from the $940–$960 area with a strong push back above EMA50 ($928) and toward prior supply near $1,080–$1,100; trend MAs are stacked bullish and rising.
Base-to-continuation: price holds above EMA50/SMA50 and breaks the $1,080–$1,100 supply zone, then trends to a retest/extension of the prior highs.
Deeper pullback: rejection near $1,080–$1,100 leads to a retrace into the rising MA cluster; buyers defend and form a higher low (or, if lost, risk of a larger correction).
2 weekly closes above $1,080 (prior swing supply) would confirm continuation
Weekly close below $900 would invalidate the near-term uptrend control (loss of EMA50/SMA50 area)
Start/add are aligned with the swing-low support + EMA50/SMA50 region; heavy add only if a deeper fib-style retrace reaches the EMA100/SMA100 area (~$855–$871) while the long-term uptrend (EMA200/SMA200) remains intact.
Trim into break/extension above prior supply ($1,080–$1,100) and potential Elliott Wave 5-style advance; progressively derisk if price becomes stretched well above EMA50/EMA100 with RSI pushing into overbought and weekly ranges expanding.
As of May 22, 2026, LLY (Eli Lilly and Company) is in a uptrend state on the weekly chart with 72% confidence. Weekly bounce from the $940–$960 area with a strong push back above EMA50 ($928) and toward prior supply near $1,080–$1,100; trend MAs are stacked bullish and rising.
On the weekly timeframe, LLY has key support at $940 and key resistance at $1090. The most likely scenario (bullish) targets $1120 and $1180, with a revert level at $1020.
LLY (Eli Lilly and Company) is currently classified as uptrend on the weekly chart, with 72% confidence. Confirmation requires: 2 weekly closes above $1,080 (prior swing supply) would confirm continuation This would be invalidated by: Weekly close below $900 would invalidate the near-term uptrend control (loss of EMA50/SMA50 area)
The most likely scenario (bullish) targets $1120 and $1180, with a revert level at $1020. The alternative scenario (bearish) targets $960 and $900.
Multi-layer AI agents analyse 200+ stocks across daily, weekly, and monthly timeframes — producing market state classifications, price scenarios with targets, and position entry/exit levels. Daily charts updated every trading day at 6 PM ET. Weekly charts refresh Fridays. Monthly charts refresh on the last trading day of each month. No paywall. No sign-up required.
Built by Foliotrail.
All content on this website — including charts, analysis, price targets, support/resistance levels, and position zones — is generated entirely by AI and provided for educational and informational purposes only.
This is not financial advice. NEXUSNOIR VENTURES SL (the operator of this website) is not a registered investment adviser or broker-dealer. You should not make investment decisions based solely on this information. Always do your own research and consult a qualified financial advisor.
By continuing, you acknowledge that you have read and agree to our full disclaimer & terms of use and privacy policy.