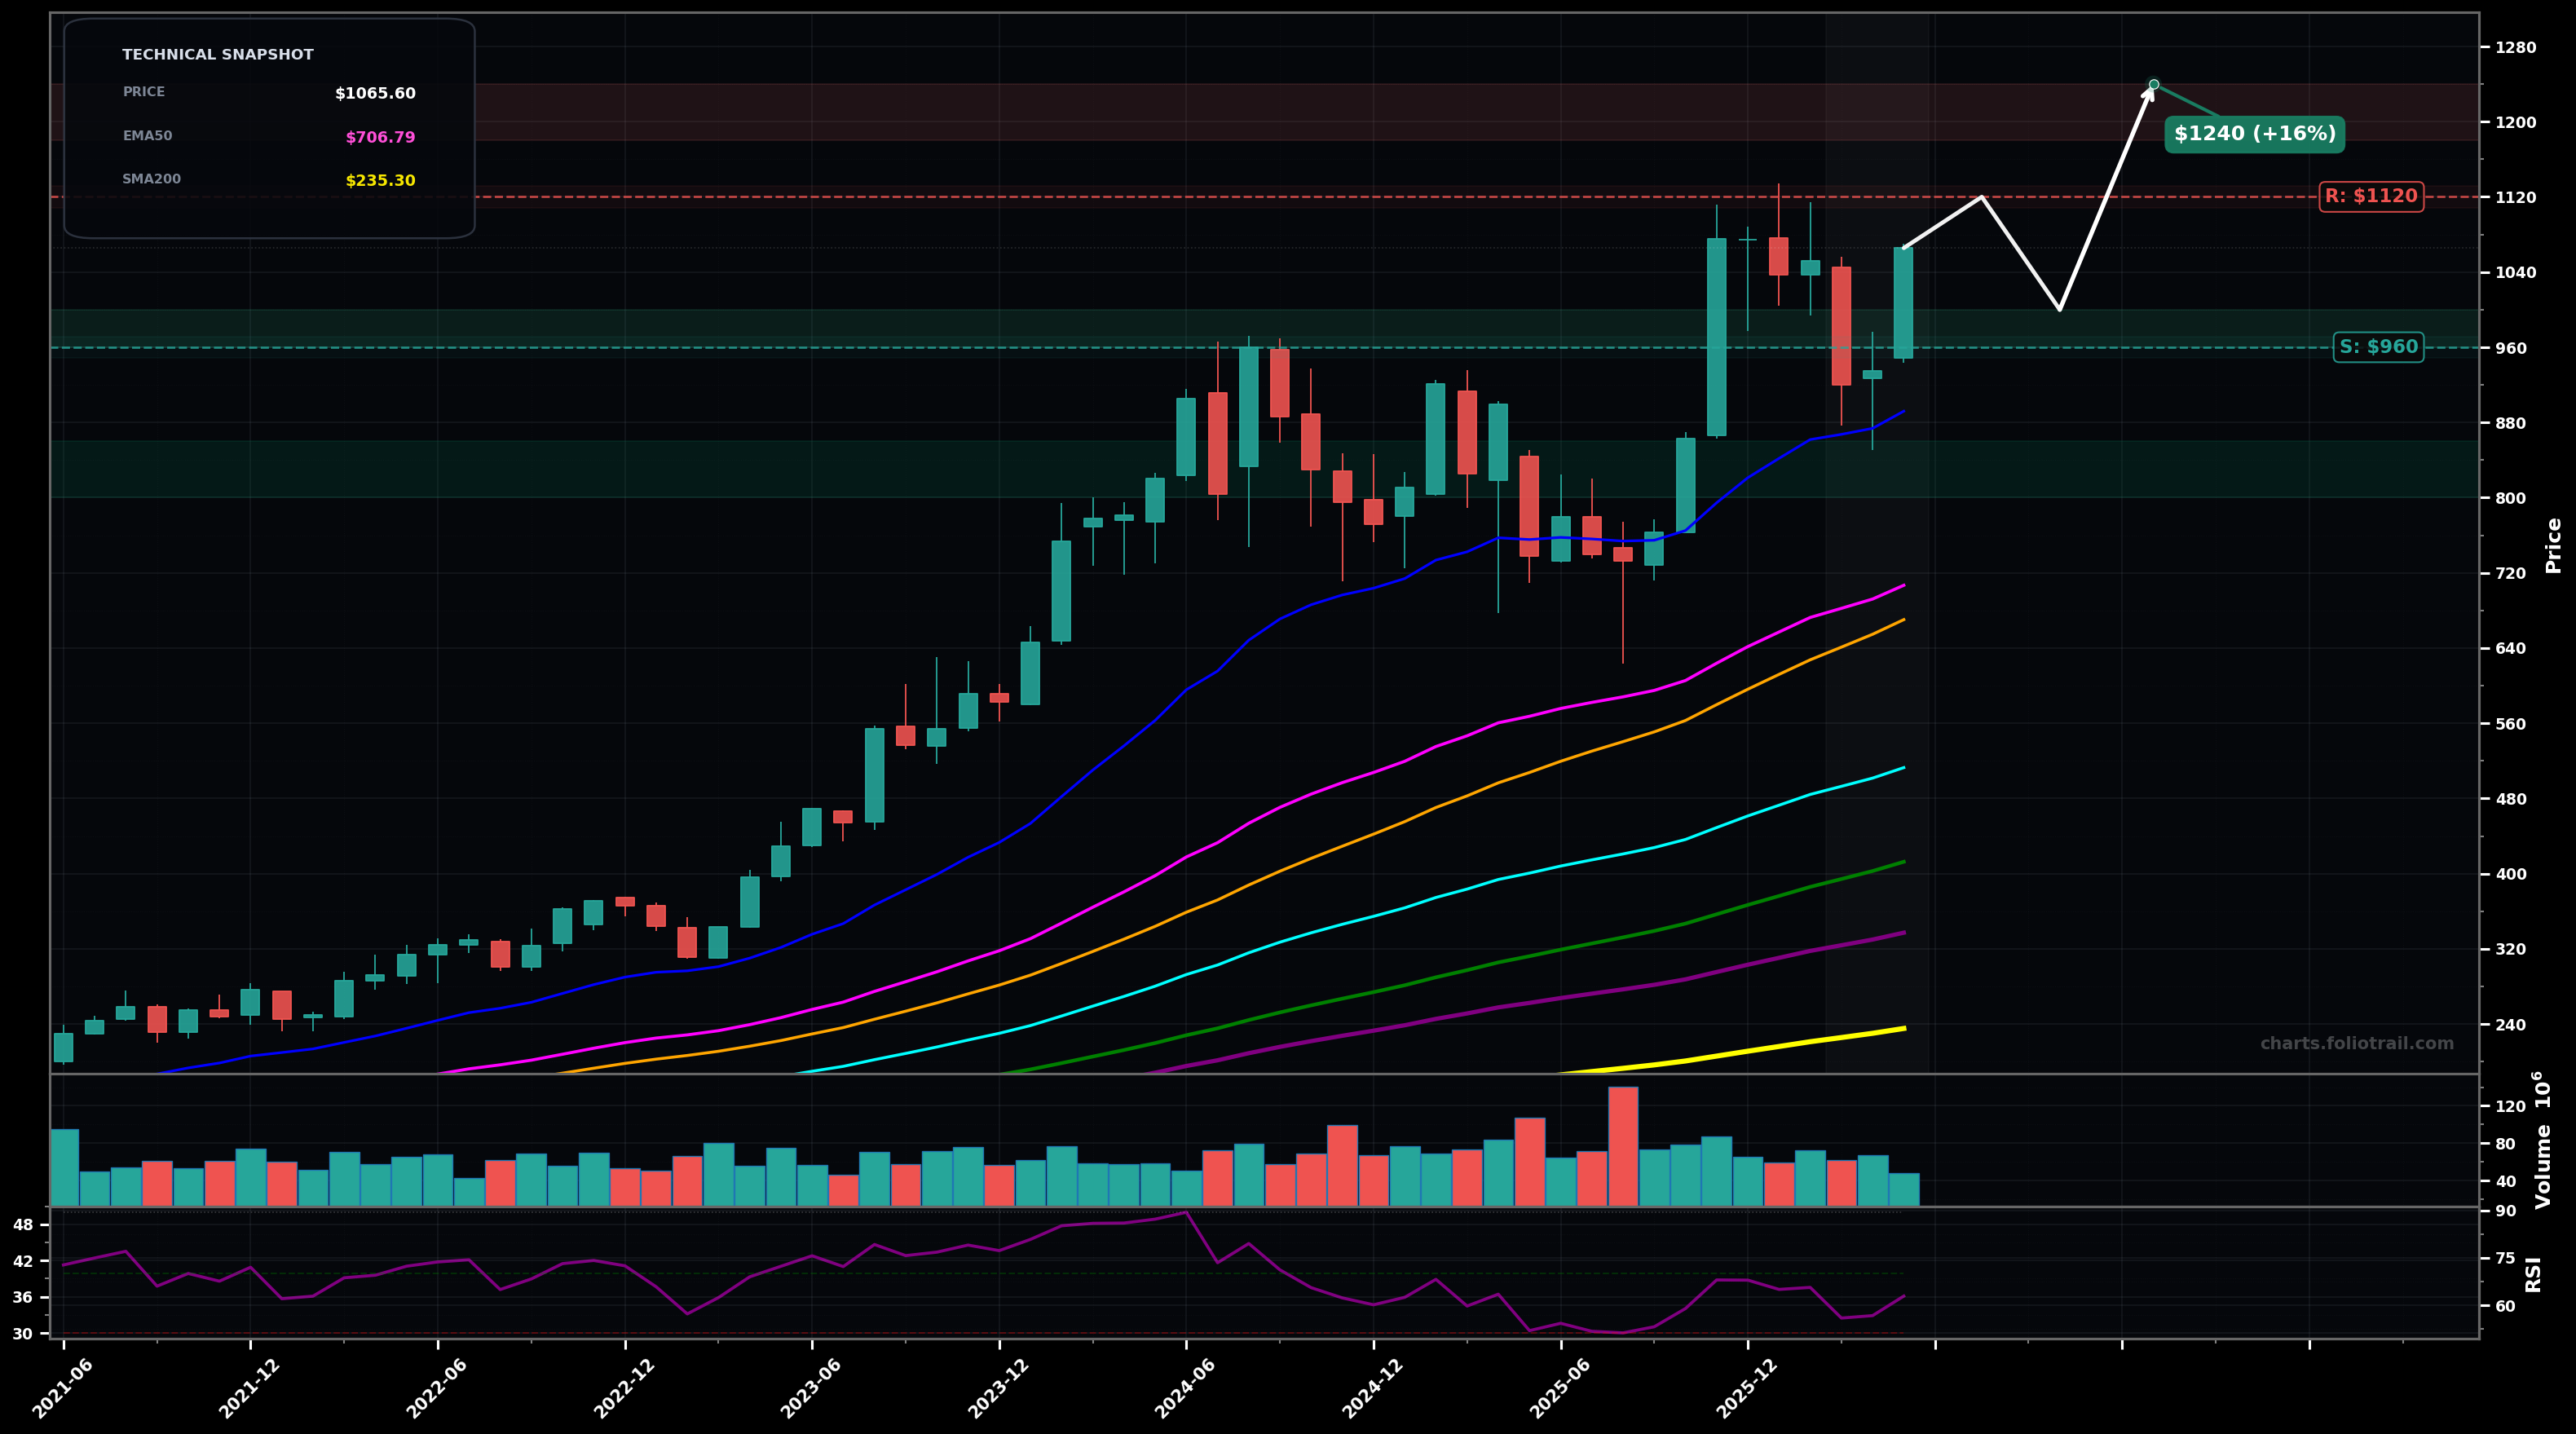
As of May 22, 2026, LLY (Eli Lilly and Company) is in a uptrend state on the monthly chart, with a confidence level of 78%. Key support is at $960 and key resistance at $1120. Monthly uptrend intact; sharp impulse to new highs near ~$1,120 followed by a pullback and rebound, with price holding well above the rising EMA50/EMA100.
Base-building above $960–$1,000 then continuation higher; likely a Wave (5) extension attempt after a Wave (4) consolidation, with $1,120 as the pivot to trigger trend continuation.
Deeper Wave (4) style pullback/ABC toward the rising EMA20/previous breakout zone; bulls defend $900–$960, but momentum cools before the next leg up.
2+ monthly closes above $1,100
Monthly close below $900
$960–$1,000 is the nearest swing-support/retest zone; $900–$960 is a deeper retrace area; $800–$860 would imply a larger fib retrace toward the rising EMA20/structure support and offers better risk/reward if reached.
Trim into strength above the prior high ($1,120) on fib extensions where monthly candles get stretched vs EMA50; heavier trimming as price pushes further into extension territory and risk of a larger multi-month mean reversion increases.
As of May 22, 2026, LLY (Eli Lilly and Company) is in a uptrend state on the monthly chart with 78% confidence. Monthly uptrend intact; sharp impulse to new highs near ~$1,120 followed by a pullback and rebound, with price holding well above the rising EMA50/EMA100.
On the monthly timeframe, LLY has key support at $960 and key resistance at $1120. The most likely scenario (bullish) targets $1120 and $1240, with a revert level at $1000.
LLY (Eli Lilly and Company) is currently classified as uptrend on the monthly chart, with 78% confidence. Confirmation requires: 2+ monthly closes above $1,100 This would be invalidated by: Monthly close below $900
The most likely scenario (bullish) targets $1120 and $1240, with a revert level at $1000. The alternative scenario (bearish) targets $960 and $900.
Multi-layer AI agents analyse 200+ stocks across daily, weekly, and monthly timeframes — producing market state classifications, price scenarios with targets, and position entry/exit levels. Daily charts updated every trading day at 6 PM ET. Weekly charts refresh Fridays. Monthly charts refresh on the last trading day of each month. No paywall. No sign-up required.
Built by Foliotrail.
All content on this website — including charts, analysis, price targets, support/resistance levels, and position zones — is generated entirely by AI and provided for educational and informational purposes only.
This is not financial advice. NEXUSNOIR VENTURES SL (the operator of this website) is not a registered investment adviser or broker-dealer. You should not make investment decisions based solely on this information. Always do your own research and consult a qualified financial advisor.
By continuing, you acknowledge that you have read and agree to our full disclaimer & terms of use and privacy policy.