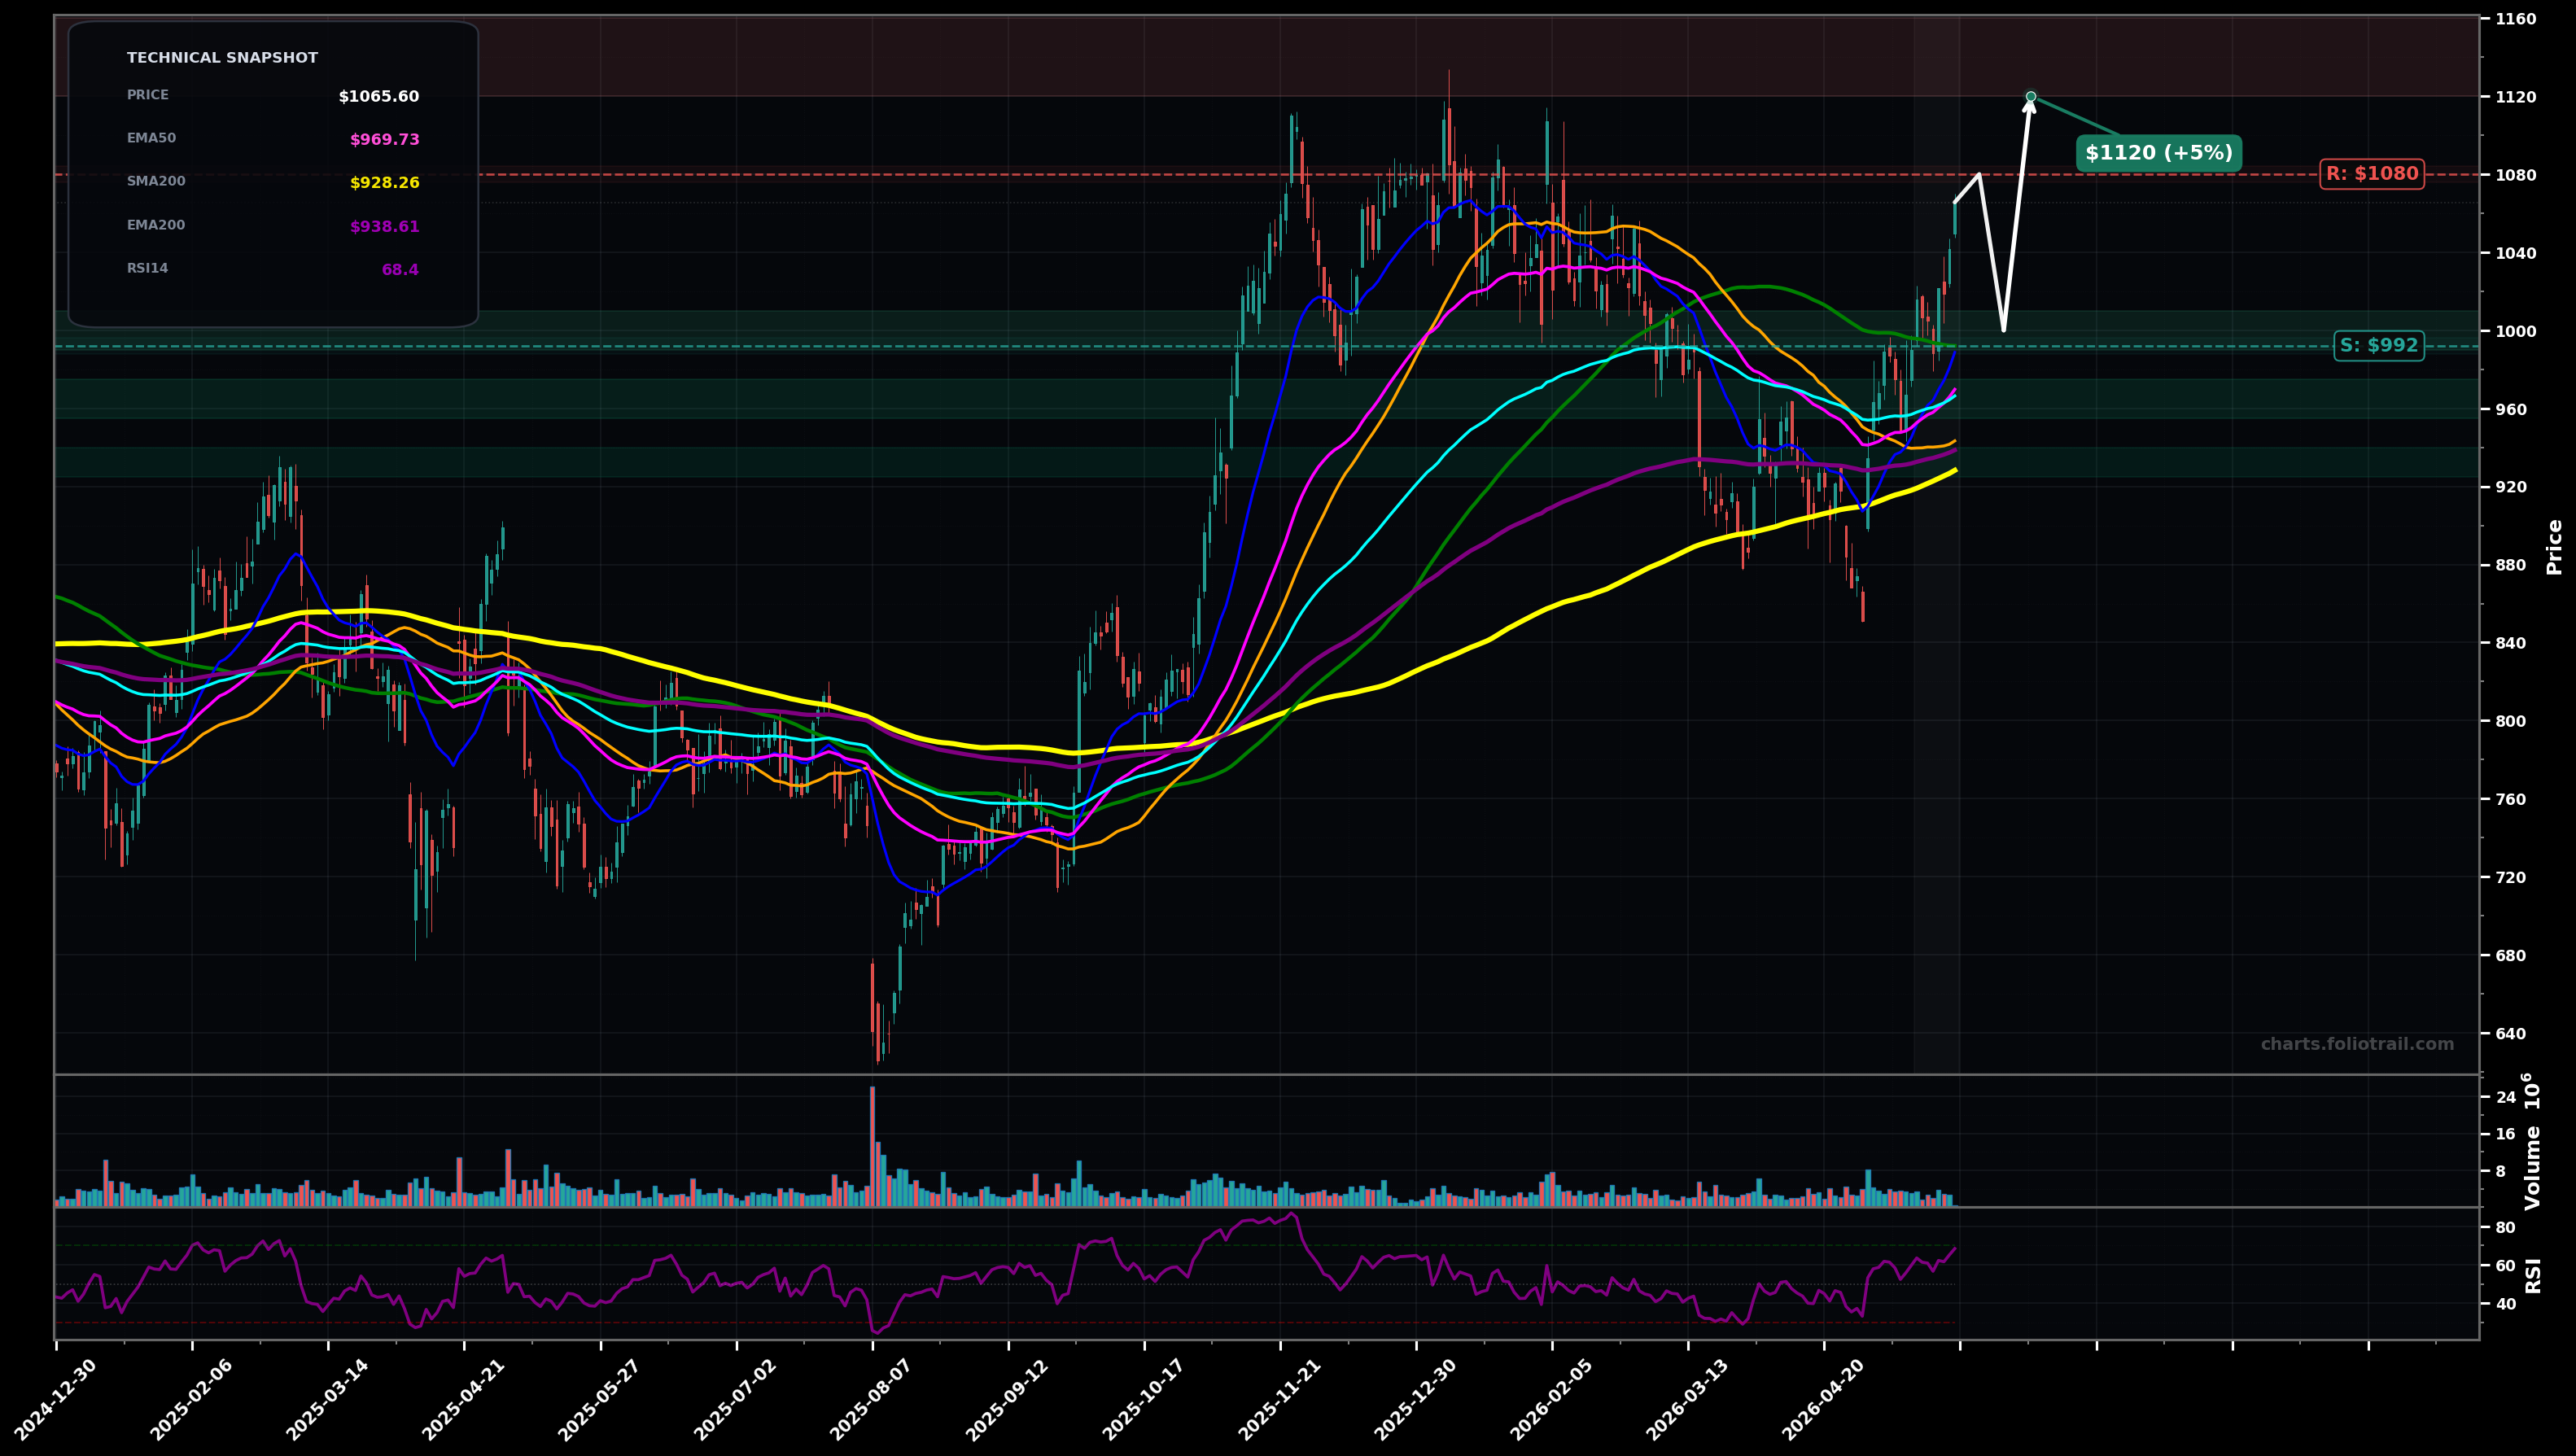
As of May 22, 2026, LLY (Eli Lilly and Company) is in a breakout reversal state on the daily chart, with a confidence level of 67%. Key support is at $992 and key resistance at $1080. Strong rally from the April swing low (~$880s) back above the full MA cluster; latest candles show upside momentum with RSI ~68 and price now well above EMA50/EMA100.
Bullish continuation: pullback/retest holds the reclaimed MA zone (SMA100/EMA50 area) then push toward prior supply near the January/February congestion and the ~$1120 spike zone.
Failed breakout: rejection at ~$1080 then a deeper mean-reversion back into the long-term MA shelf (EMA200/SMA200 area).
2+ daily closes above $1080
Daily close back below $992
Start on pullback into reclaimed SMA100/round-$1000; add if price revisits EMA100/EMA200 confluence; heavy add near EMA200/SMA200 shelf where prior demand repeatedly showed up.
Trim into prior highs/extension zones above $1120; increase trimming on a measured move beyond the range highs; close if price becomes far extended above long MAs with momentum likely mature (late-wave risk).
As of May 22, 2026, LLY (Eli Lilly and Company) is in a breakout reversal state on the daily chart with 67% confidence. Strong rally from the April swing low (~$880s) back above the full MA cluster; latest candles show upside momentum with RSI ~68 and price now well above EMA50/EMA100.
On the daily timeframe, LLY has key support at $992 and key resistance at $1080. The most likely scenario (bullish) targets $1080 and $1120, with a revert level at $1000.
LLY (Eli Lilly and Company) is currently classified as breakout reversal on the daily chart, with 67% confidence. Confirmation requires: 2+ daily closes above $1080 This would be invalidated by: Daily close back below $992
The most likely scenario (bullish) targets $1080 and $1120, with a revert level at $1000. The alternative scenario (bearish) targets $992 and $940.
Multi-layer AI agents analyse 200+ stocks across daily, weekly, and monthly timeframes — producing market state classifications, price scenarios with targets, and position entry/exit levels. Daily charts updated every trading day at 6 PM ET. Weekly charts refresh Fridays. Monthly charts refresh on the last trading day of each month. No paywall. No sign-up required.
Built by Foliotrail.
All content on this website — including charts, analysis, price targets, support/resistance levels, and position zones — is generated entirely by AI and provided for educational and informational purposes only.
This is not financial advice. NEXUSNOIR VENTURES SL (the operator of this website) is not a registered investment adviser or broker-dealer. You should not make investment decisions based solely on this information. Always do your own research and consult a qualified financial advisor.
By continuing, you acknowledge that you have read and agree to our full disclaimer & terms of use and privacy policy.