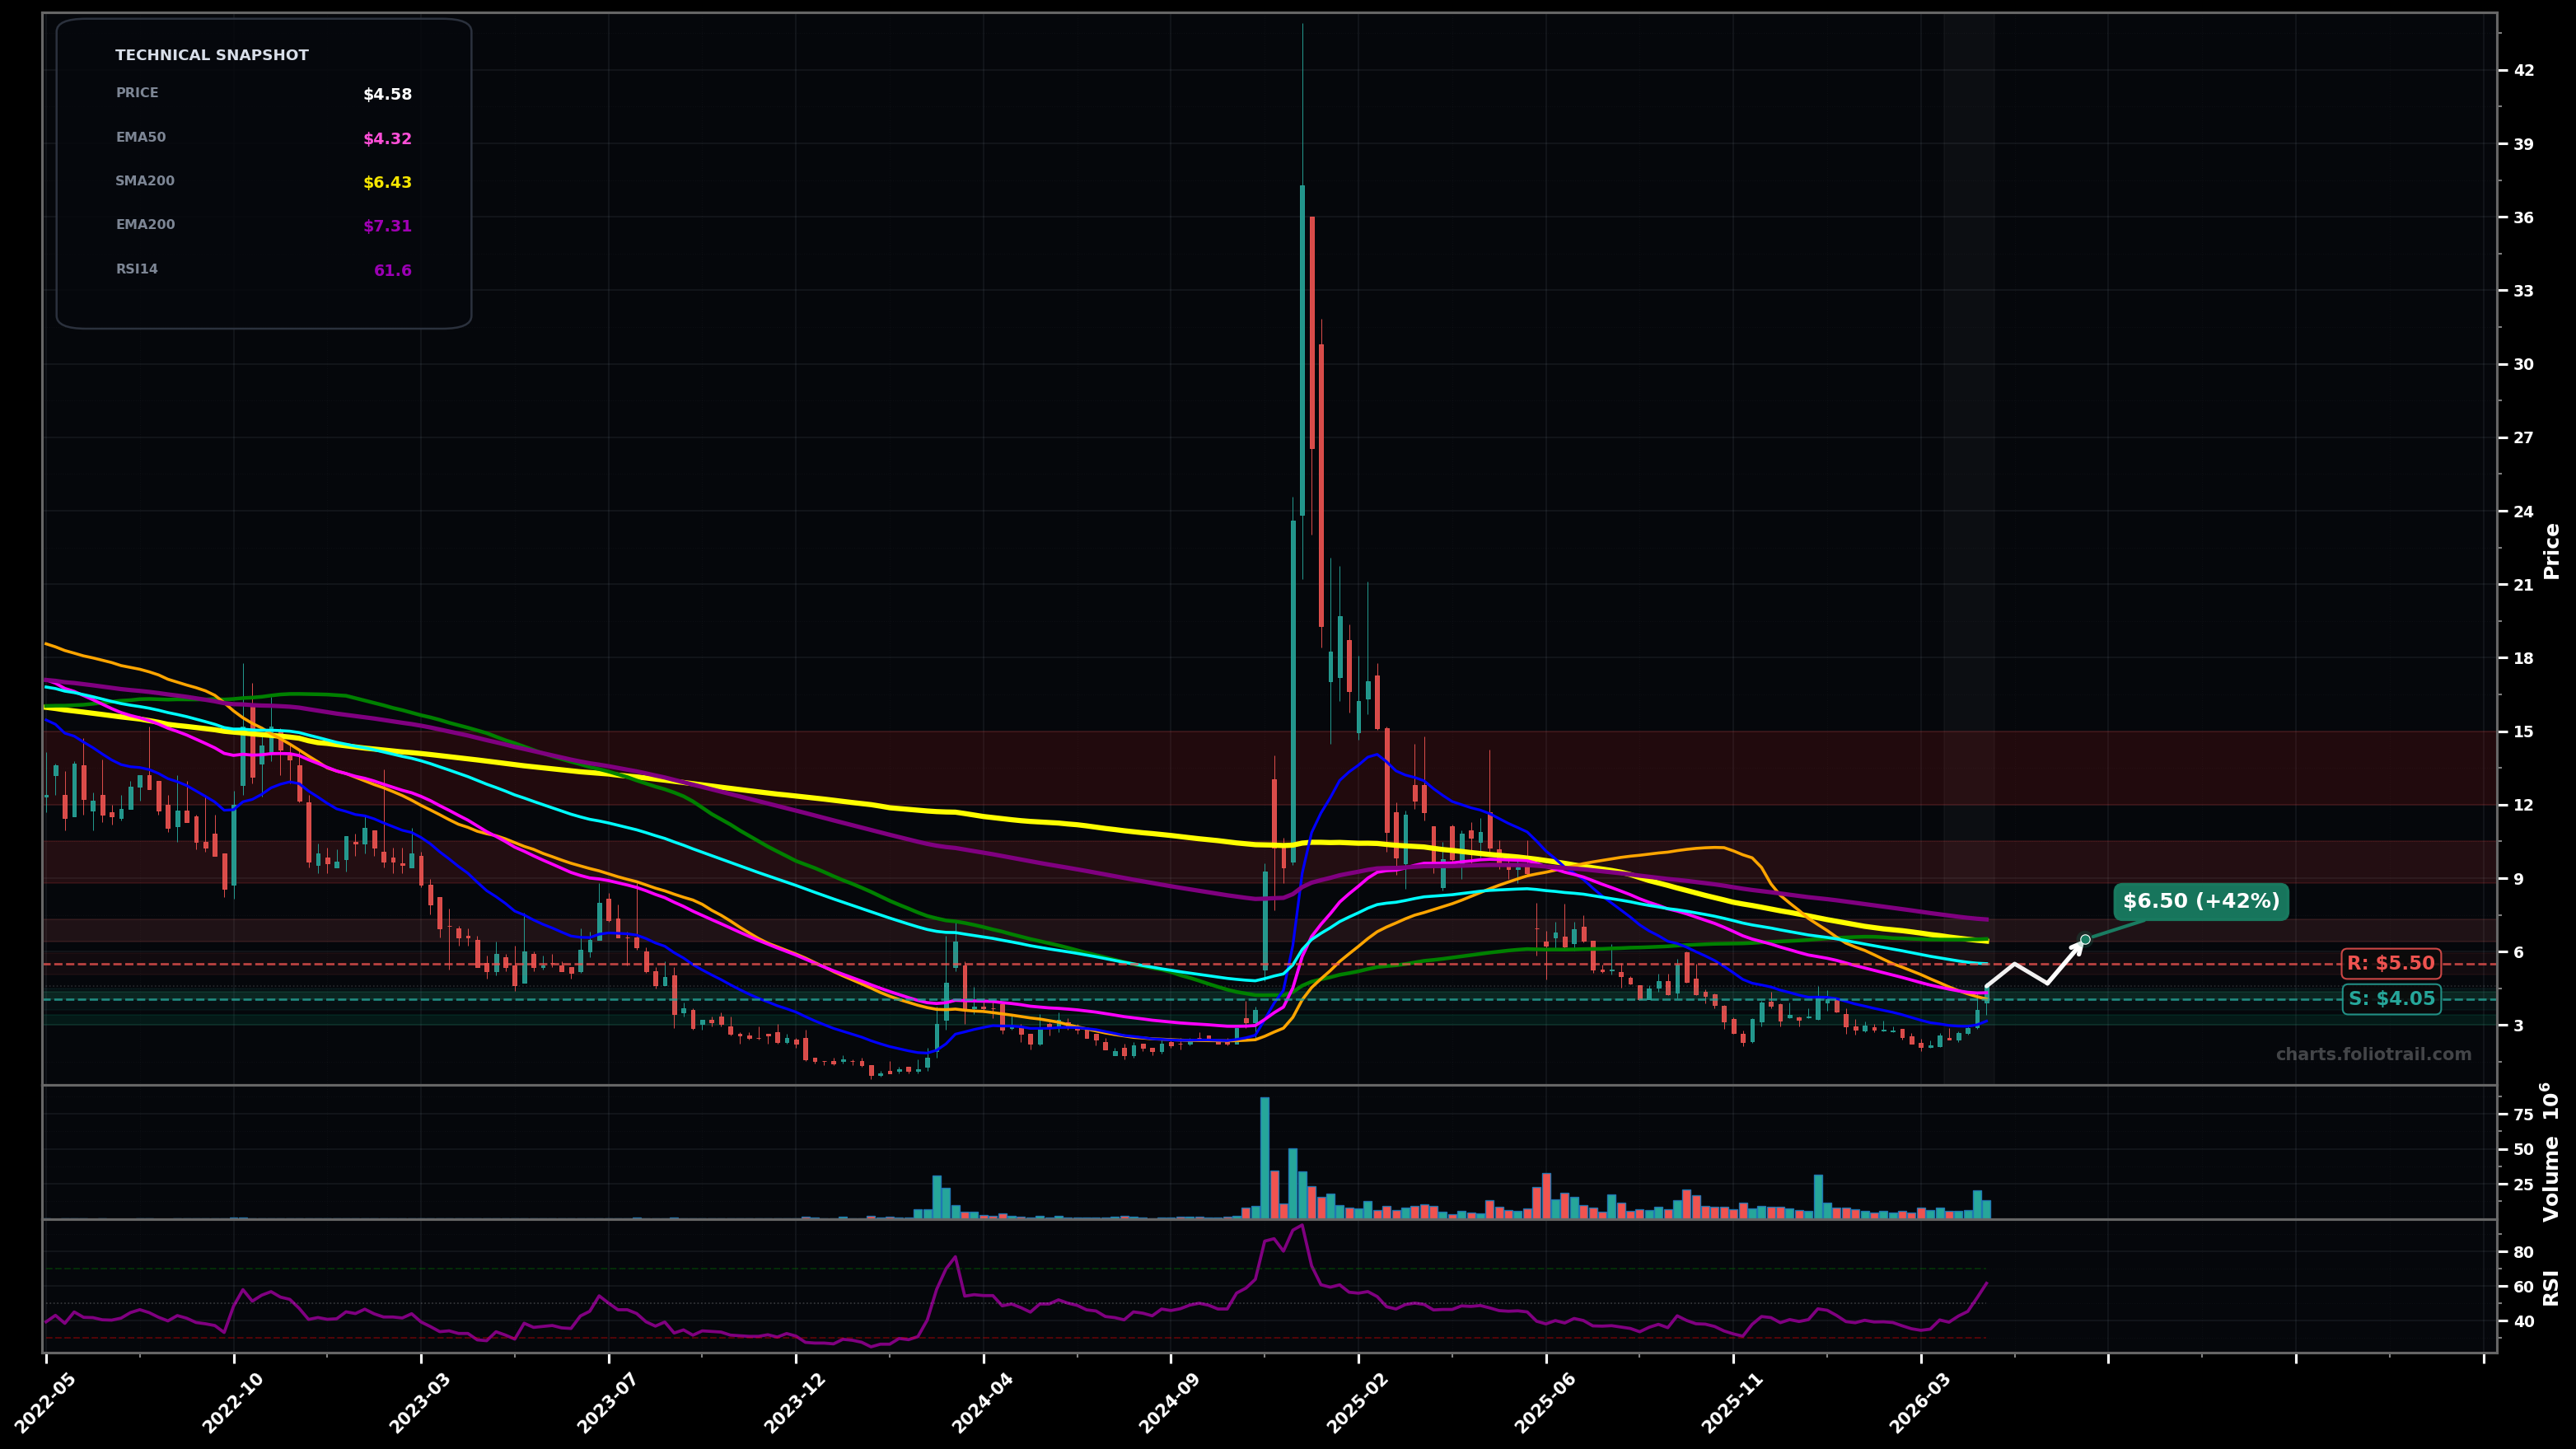
As of May 22, 2026, KULR (KULR Technology Group, Inc.) is in a bottoming attempt state on the weekly chart, with a confidence level of 62%. Key support is at $4.05 and key resistance at $5.50. Weekly rebound to ~$4.58 with RSI ~62; price reclaimed above EMA50 (~$4.32) and SMA50 (~$4.06) but remains below EMA100 (~$5.50) and major long MAs (SMA100/200, EMA200).
Continuation of the rebound: price holds above $4.05–$4.32, then grinds up into the heavy MA cluster; likely a corrective rally (Elliott: larger-degree Wave (2)/(B) bounce within a still-bearish structure) aiming for the next Fib/MA resistances.
Failed reclaim: rejection at $5.50 (EMA100) sends price back into the base; if $4.05 breaks, a retest of the prior swing-low zone follows (Elliott: Wave (3)/(C) continuation risk if breakdown resumes).
2+ weekly closes above $5.50 (EMA100) with follow-through toward $6.50.
Weekly close back below $3.80 (loss of the recent breakout area/near-term HL).
Start on support/MA reclaim ($4.05–$4.35); add on pullbacks that keep structure intact; heavy add only on deeper retest near prior base/swing-low zone where risk-reward improves.
Trim into the MA supply stack (SMA100/200 + EMA200 overhead around $6.5–$7.3) and progressively derisk as price revisits former distribution levels from 2024–2025 where sellers previously dominated.
As of May 22, 2026, KULR (KULR Technology Group, Inc.) is in a bottoming attempt state on the weekly chart with 62% confidence. Weekly rebound to ~$4.58 with RSI ~62; price reclaimed above EMA50 (~$4.32) and SMA50 (~$4.06) but remains below EMA100 (~$5.50) and major long MAs (SMA100/200, EMA200).
On the weekly timeframe, KULR has key support at $4.05 and key resistance at $5.50. The most likely scenario (bullish) targets $5.50 and $6.50, with a revert level at $4.70.
KULR (KULR Technology Group, Inc.) is currently classified as bottoming attempt on the weekly chart, with 62% confidence. Confirmation requires: 2+ weekly closes above $5.50 (EMA100) with follow-through toward $6.50. This would be invalidated by: Weekly close back below $3.80 (loss of the recent breakout area/near-term HL).
The most likely scenario (bullish) targets $5.50 and $6.50, with a revert level at $4.70. The alternative scenario (bearish) targets $4.05 and $3.20.
Multi-layer AI agents analyse 200+ stocks across daily, weekly, and monthly timeframes — producing market state classifications, price scenarios with targets, and position entry/exit levels. Daily charts updated every trading day at 6 PM ET. Weekly charts refresh Fridays. Monthly charts refresh on the last trading day of each month. No paywall. No sign-up required.
Built by Foliotrail.
All content on this website — including charts, analysis, price targets, support/resistance levels, and position zones — is generated entirely by AI and provided for educational and informational purposes only.
This is not financial advice. NEXUSNOIR VENTURES SL (the operator of this website) is not a registered investment adviser or broker-dealer. You should not make investment decisions based solely on this information. Always do your own research and consult a qualified financial advisor.
By continuing, you acknowledge that you have read and agree to our full disclaimer & terms of use and privacy policy.