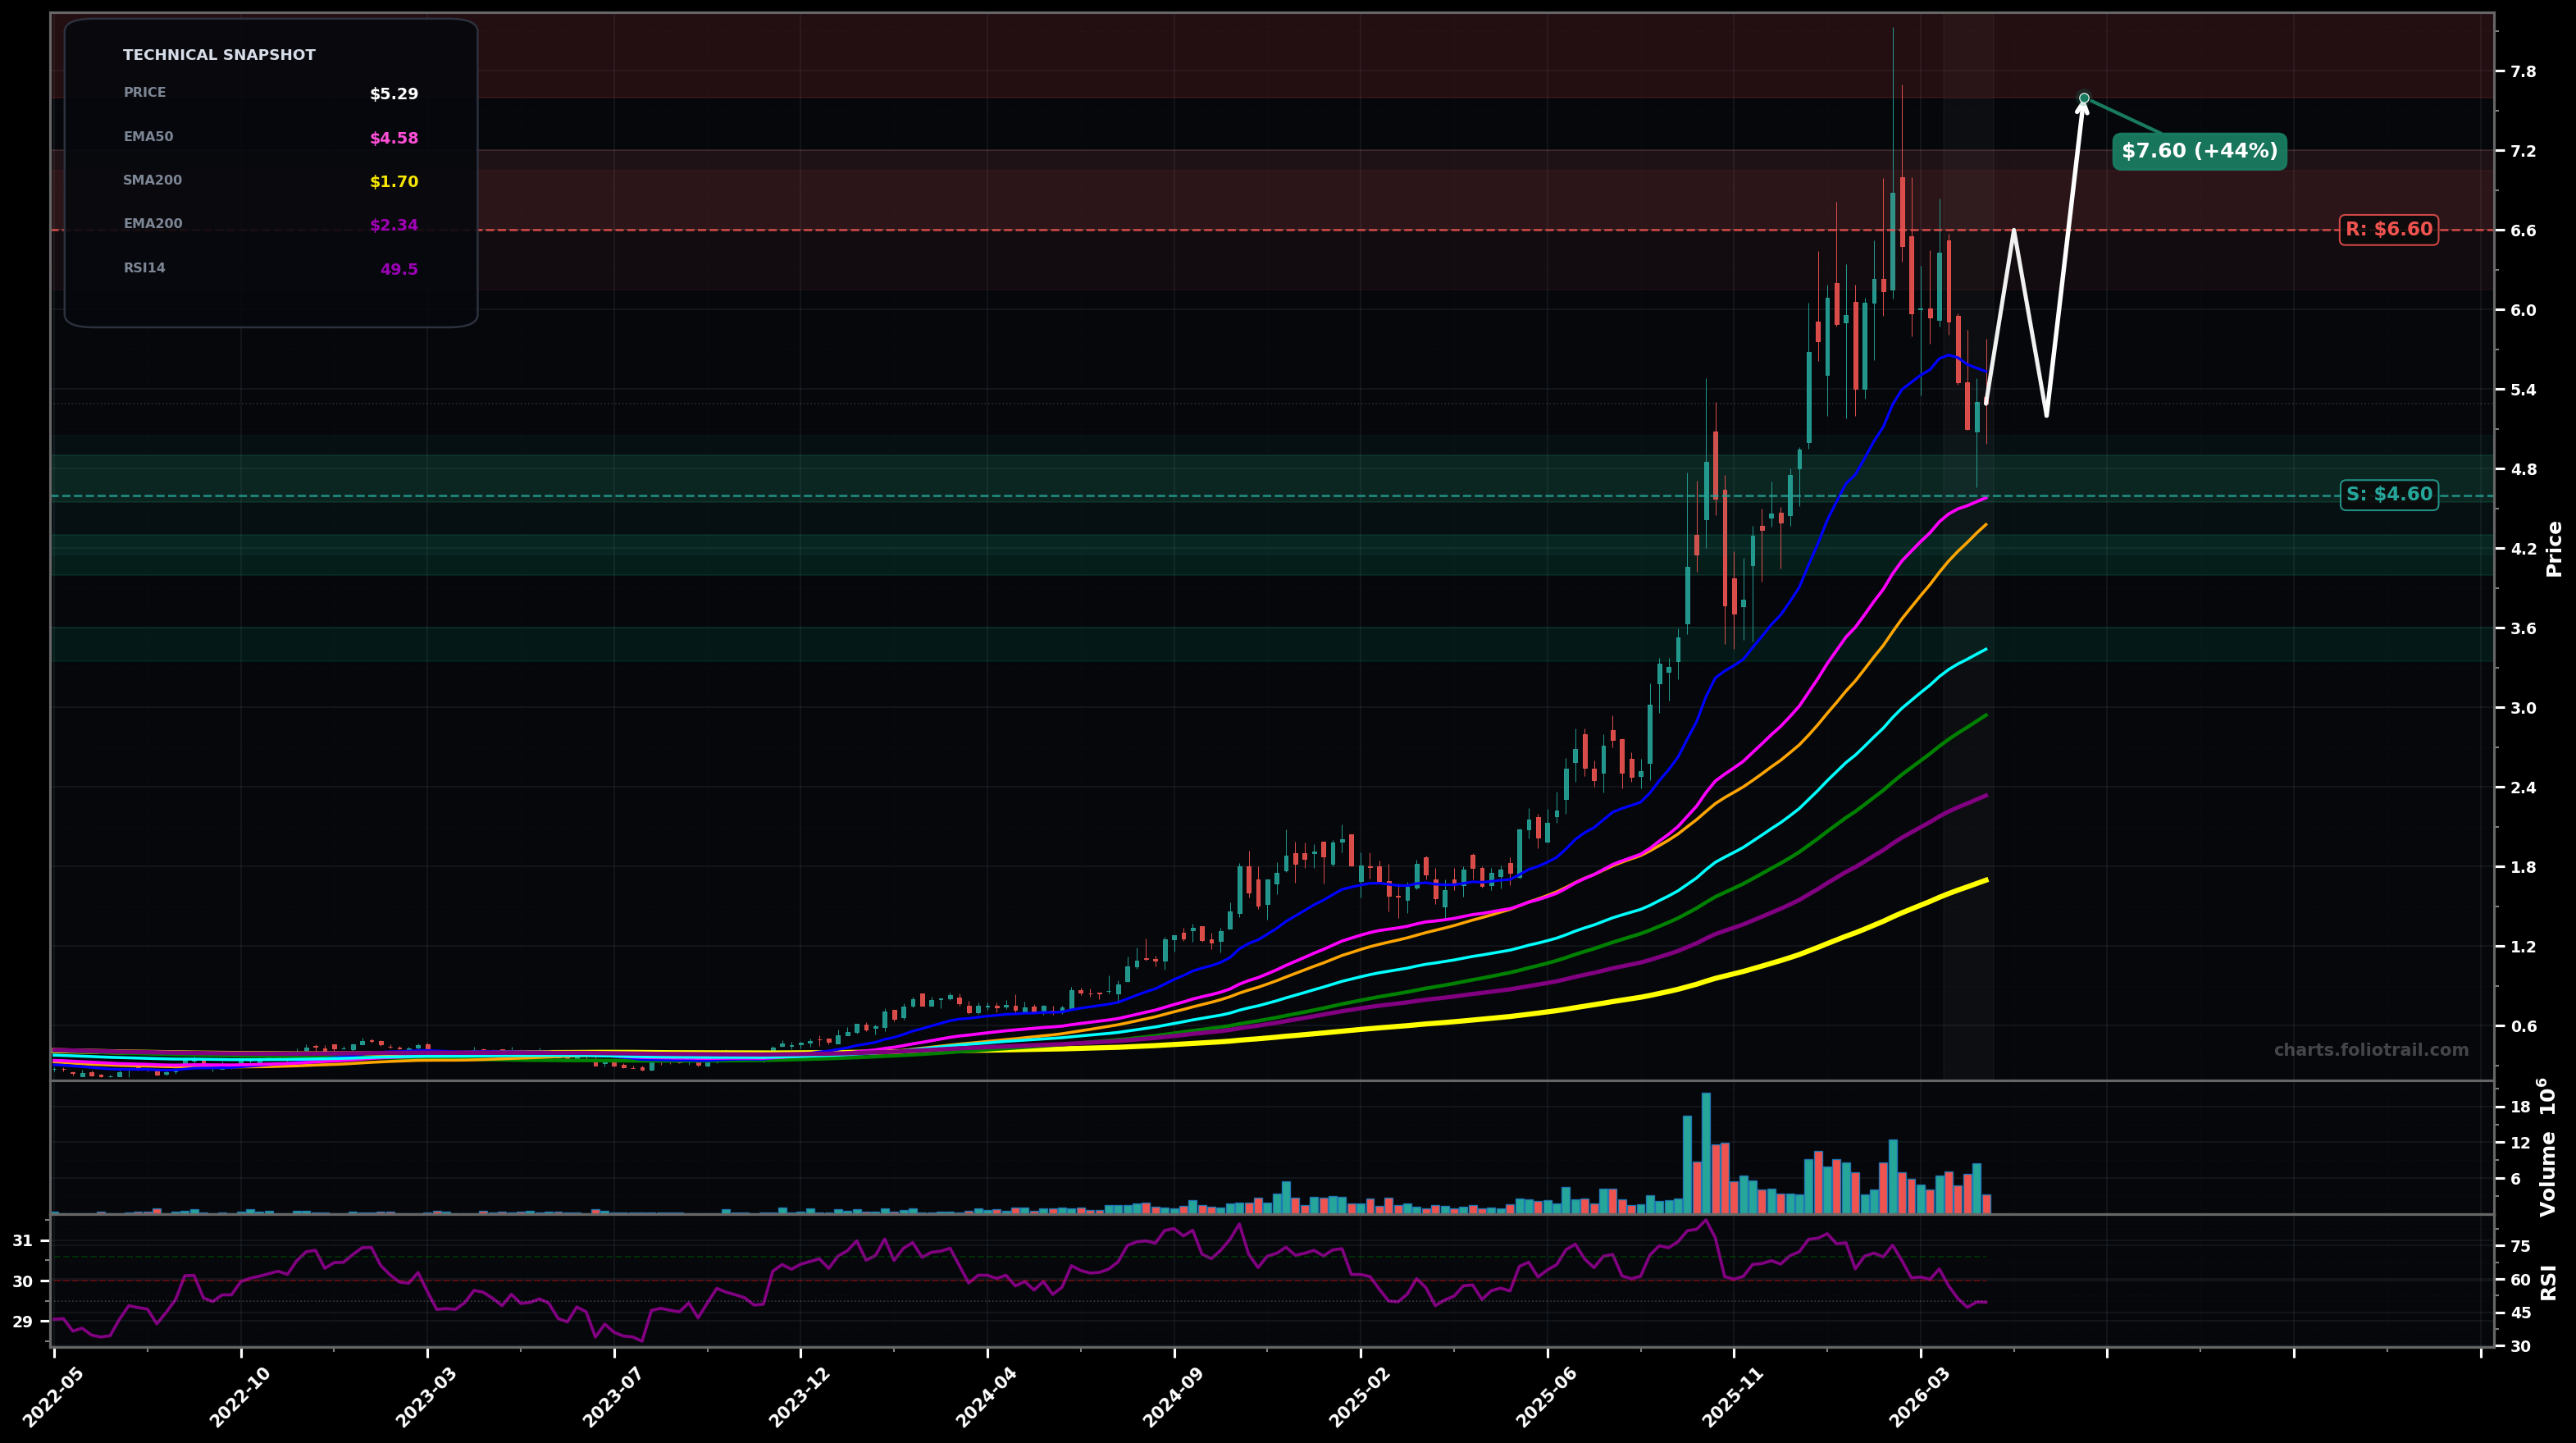
As of May 22, 2026, KRKNF (Kraken Robotics Inc.) is in a uptrend state on the weekly chart, with a confidence level of 62%. Key support is at $4.60 and key resistance at $6.60. Weekly pullback from the ~$6.8-$7.6 spike high into the EMA20 (~$5.53); price still above EMA50 (~$4.58) with RSI ~49 (neutral).
Bullish continuation: ABC/pullback completes above EMA50, then trend resumes toward prior highs (Elliott: Wave 4 correction finishing, setting up Wave 5 attempt).
Deeper corrective retrace: loses EMA50 and mean-reverts toward the rising EMA100/SMA100 cluster before stabilizing (Elliott: Wave 4 expands into a larger flat/zigzag).
Weekly close back above $5.60-$5.80 (reclaim EMA20 area) with follow-through
Weekly close below $4.55 (loss of EMA50/pink) and failure to reclaim it within 2-3 weeks
Start near EMA50/pivot support; add on deeper fib-style retrace into prior breakout zone; heavy add near EMA100 (~$3.44)/SMA100 (~$2.94) confluence and likely Wave-4 support.
Trim into prior supply (old highs) and extensions after a Wave-5 push; heavier trimming on clear blow-off/extension beyond prior peak; full close only if price enters a multi-year stretch/mania zone versus long MAs.
As of May 22, 2026, KRKNF (Kraken Robotics Inc.) is in a uptrend state on the weekly chart with 62% confidence. Weekly pullback from the ~$6.8-$7.6 spike high into the EMA20 (~$5.53); price still above EMA50 (~$4.58) with RSI ~49 (neutral).
On the weekly timeframe, KRKNF has key support at $4.60 and key resistance at $6.60. The most likely scenario (bullish) targets $6.60 and $7.60, with a revert level at $5.20.
KRKNF (Kraken Robotics Inc.) is currently classified as uptrend on the weekly chart, with 62% confidence. Confirmation requires: Weekly close back above $5.60-$5.80 (reclaim EMA20 area) with follow-through This would be invalidated by: Weekly close below $4.55 (loss of EMA50/pink) and failure to reclaim it within 2-3 weeks
The most likely scenario (bullish) targets $6.60 and $7.60, with a revert level at $5.20. The alternative scenario (bearish) targets $4.10 and $3.45.
Multi-layer AI agents analyse 200+ stocks across daily, weekly, and monthly timeframes — producing market state classifications, price scenarios with targets, and position entry/exit levels. Daily charts updated every trading day at 6 PM ET. Weekly charts refresh Fridays. Monthly charts refresh on the last trading day of each month. No paywall. No sign-up required.
Built by Foliotrail.
All content on this website — including charts, analysis, price targets, support/resistance levels, and position zones — is generated entirely by AI and provided for educational and informational purposes only.
This is not financial advice. NEXUSNOIR VENTURES SL (the operator of this website) is not a registered investment adviser or broker-dealer. You should not make investment decisions based solely on this information. Always do your own research and consult a qualified financial advisor.
By continuing, you acknowledge that you have read and agree to our full disclaimer & terms of use and privacy policy.