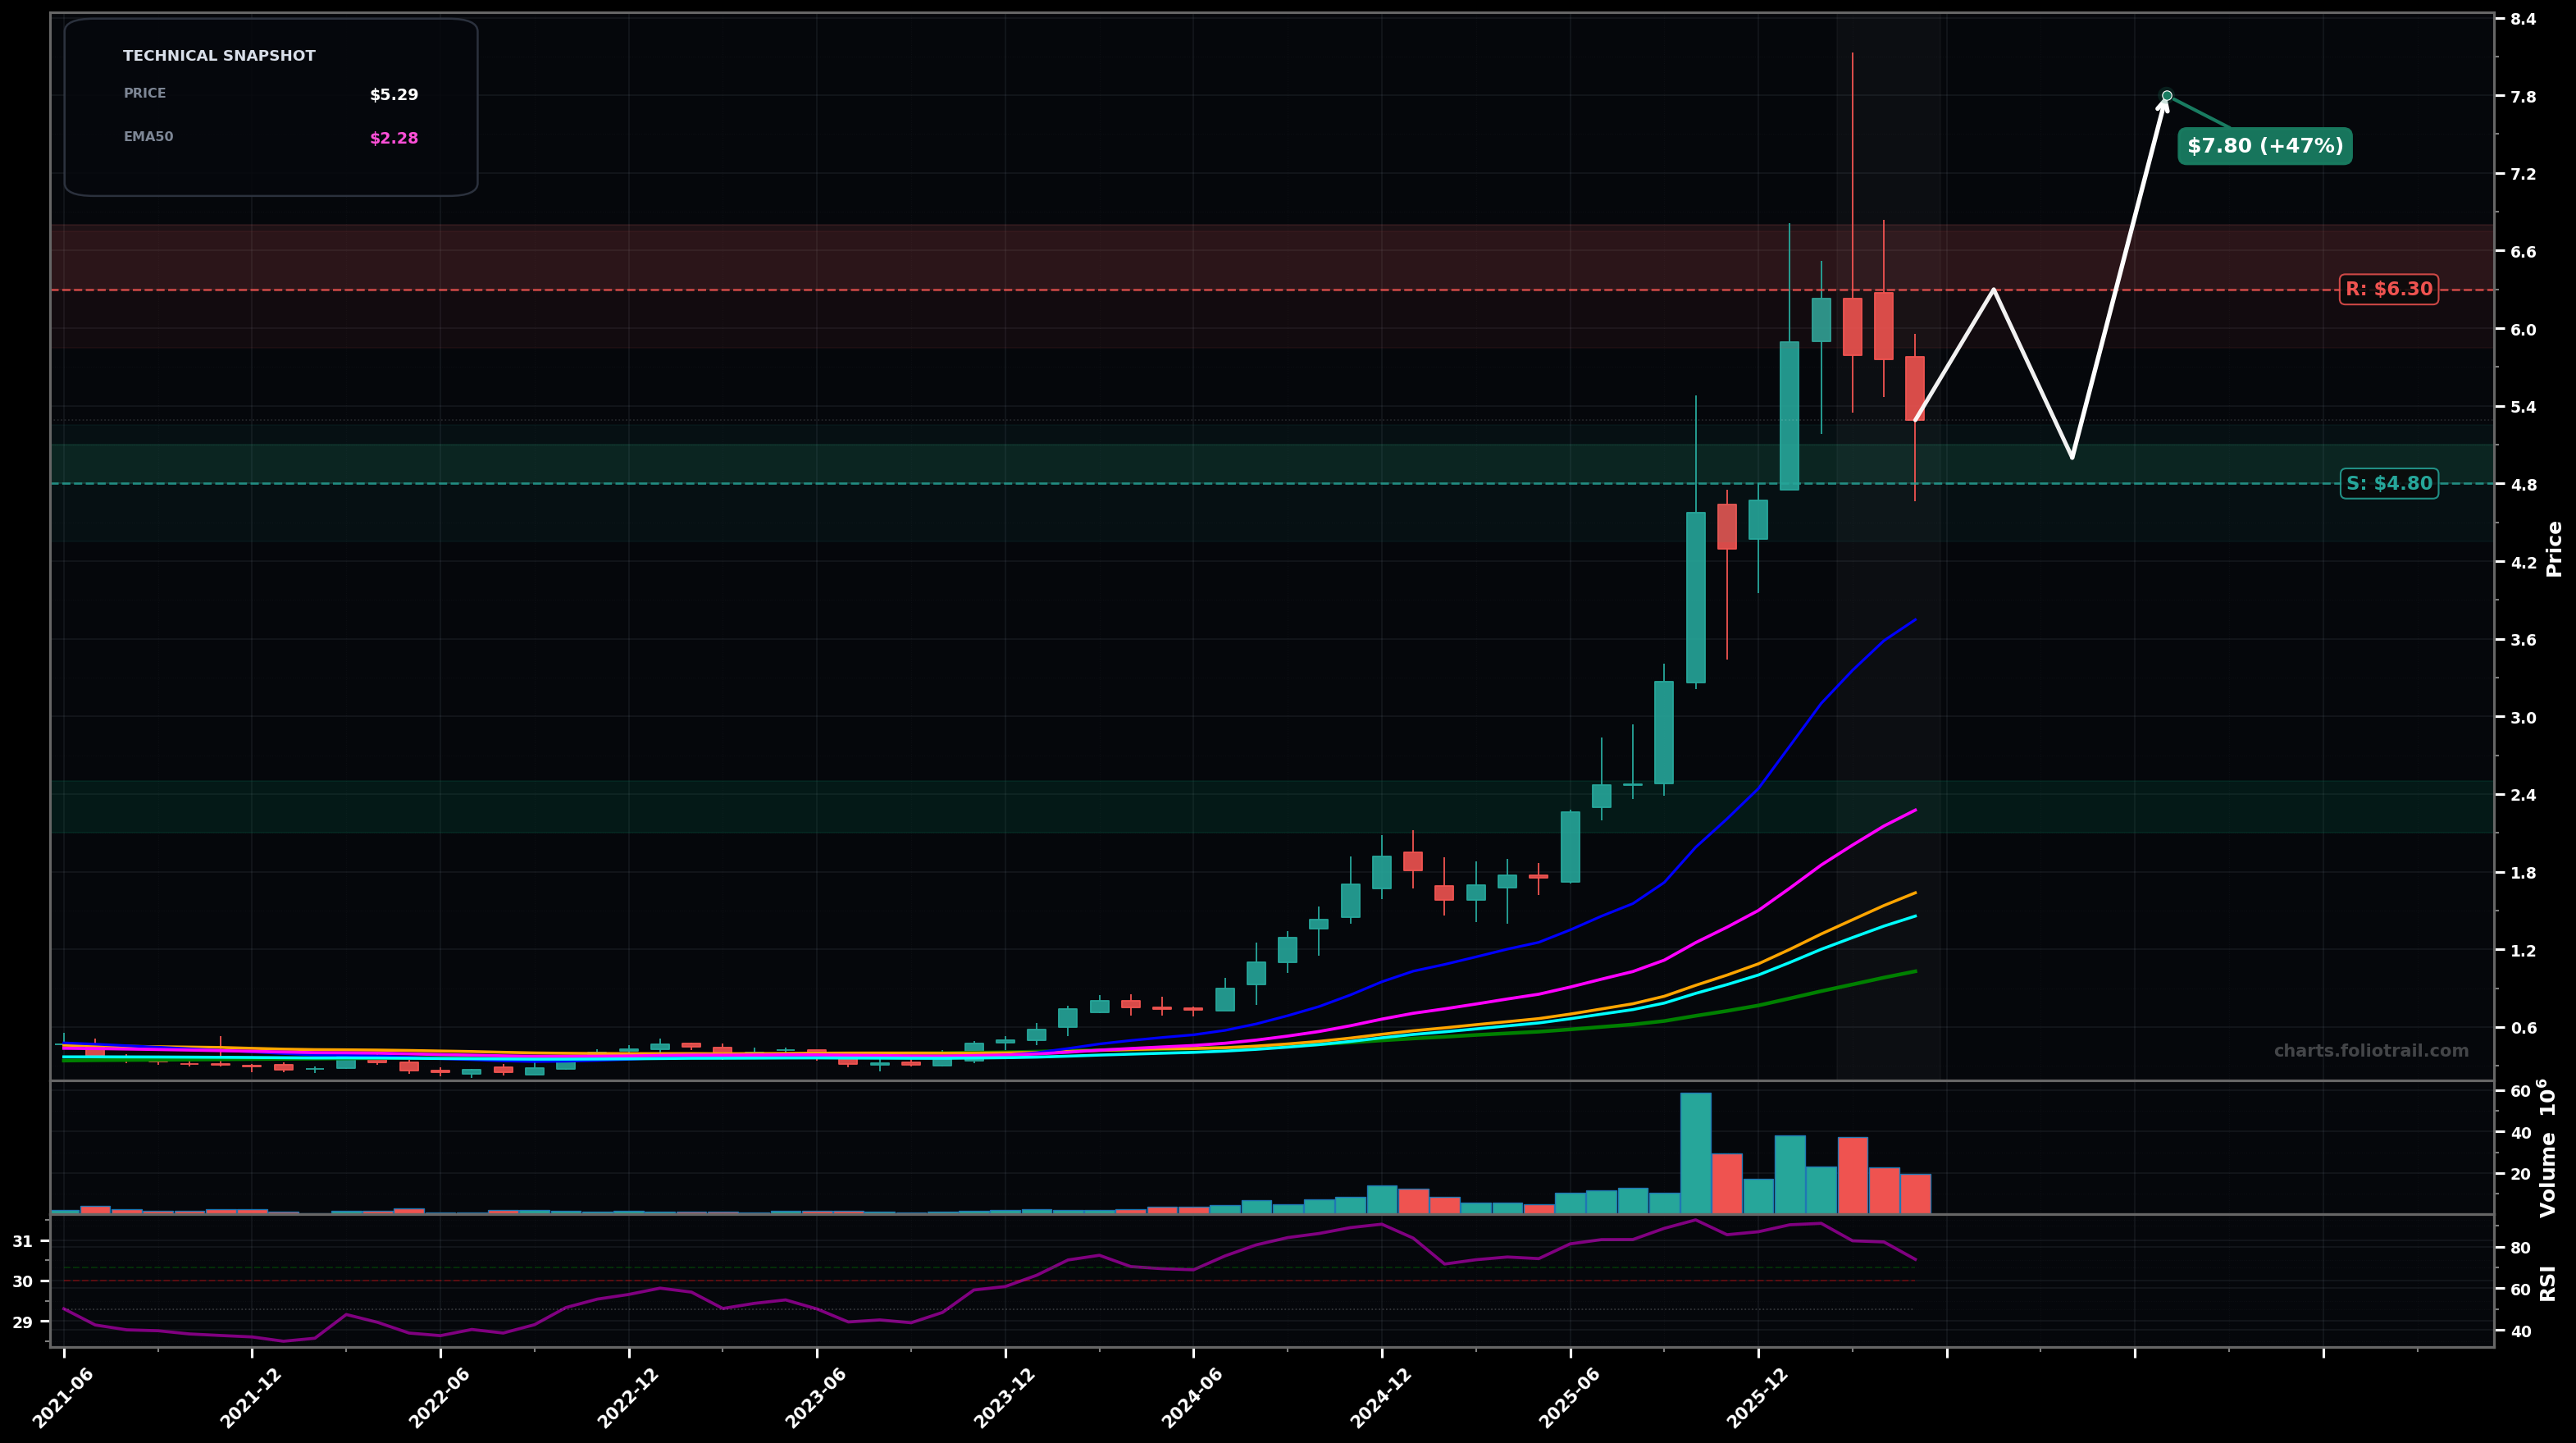
As of May 22, 2026, KRKNF (Kraken Robotics Inc.) is in a uptrend state on the monthly chart, with a confidence level of 72%. Key support is at $4.80 and key resistance at $6.30. Monthly uptrend paused: sharp rally to ~$6.3–$6.6 then 2–3 red pullback candles; price still well above rising EMA50/100; RSI ~74 cooling from overbought.
Bullish continuation after a healthy Wave-4 style pullback: price holds $4.8–$5.0 support, bases 1–3 months, then attempts a new high (Wave 5) driven by trend MAs and prior breakout structure.
Deeper mean-reversion: the pullback extends into a larger ABC correction as momentum cools from overbought; price undercuts $4.8 and gravitates toward the 20/50 EMA cluster to reset before any next leg up.
Monthly close back above ~$6.30 (recent swing/failed breakout area) would confirm trend continuation
Monthly close below ~$3.75 (EMA20 zone / prior impulse support) would invalidate the current uptrend momentum and raise deeper-correction odds
Start near the first pullback support (~$4.8–$5.1); add on a deeper retrace into EMA20/structure (~$3.6–$4.1); heavy add only if price mean-reverts to the rising EMA50 zone (~$2.1–$2.5) where trend support is strongest.
Trim into prior swing-high resistance and extension zones ($6.3+), trim more on an upside extension into ~$7.8–$8.8, and consider full exit only on a multi-year stretched blow-off region (~$9.8–$12) far above the rising EMA50/100.
As of May 22, 2026, KRKNF (Kraken Robotics Inc.) is in a uptrend state on the monthly chart with 72% confidence. Monthly uptrend paused: sharp rally to ~$6.3–$6.6 then 2–3 red pullback candles; price still well above rising EMA50/100; RSI ~74 cooling from overbought.
On the monthly timeframe, KRKNF has key support at $4.80 and key resistance at $6.30. The most likely scenario (bullish) targets $6.30 and $7.80, with a revert level at $5.00.
KRKNF (Kraken Robotics Inc.) is currently classified as uptrend on the monthly chart, with 72% confidence. Confirmation requires: Monthly close back above ~$6.30 (recent swing/failed breakout area) would confirm trend continuation This would be invalidated by: Monthly close below ~$3.75 (EMA20 zone / prior impulse support) would invalidate the current uptrend momentum and raise deeper-correction odds
The most likely scenario (bullish) targets $6.30 and $7.80, with a revert level at $5.00. The alternative scenario (bearish) targets $3.75 and $2.30.
Multi-layer AI agents analyse 200+ stocks across daily, weekly, and monthly timeframes — producing market state classifications, price scenarios with targets, and position entry/exit levels. Daily charts updated every trading day at 6 PM ET. Weekly charts refresh Fridays. Monthly charts refresh on the last trading day of each month. No paywall. No sign-up required.
Built by Foliotrail.
All content on this website — including charts, analysis, price targets, support/resistance levels, and position zones — is generated entirely by AI and provided for educational and informational purposes only.
This is not financial advice. NEXUSNOIR VENTURES SL (the operator of this website) is not a registered investment adviser or broker-dealer. You should not make investment decisions based solely on this information. Always do your own research and consult a qualified financial advisor.
By continuing, you acknowledge that you have read and agree to our full disclaimer & terms of use and privacy policy.