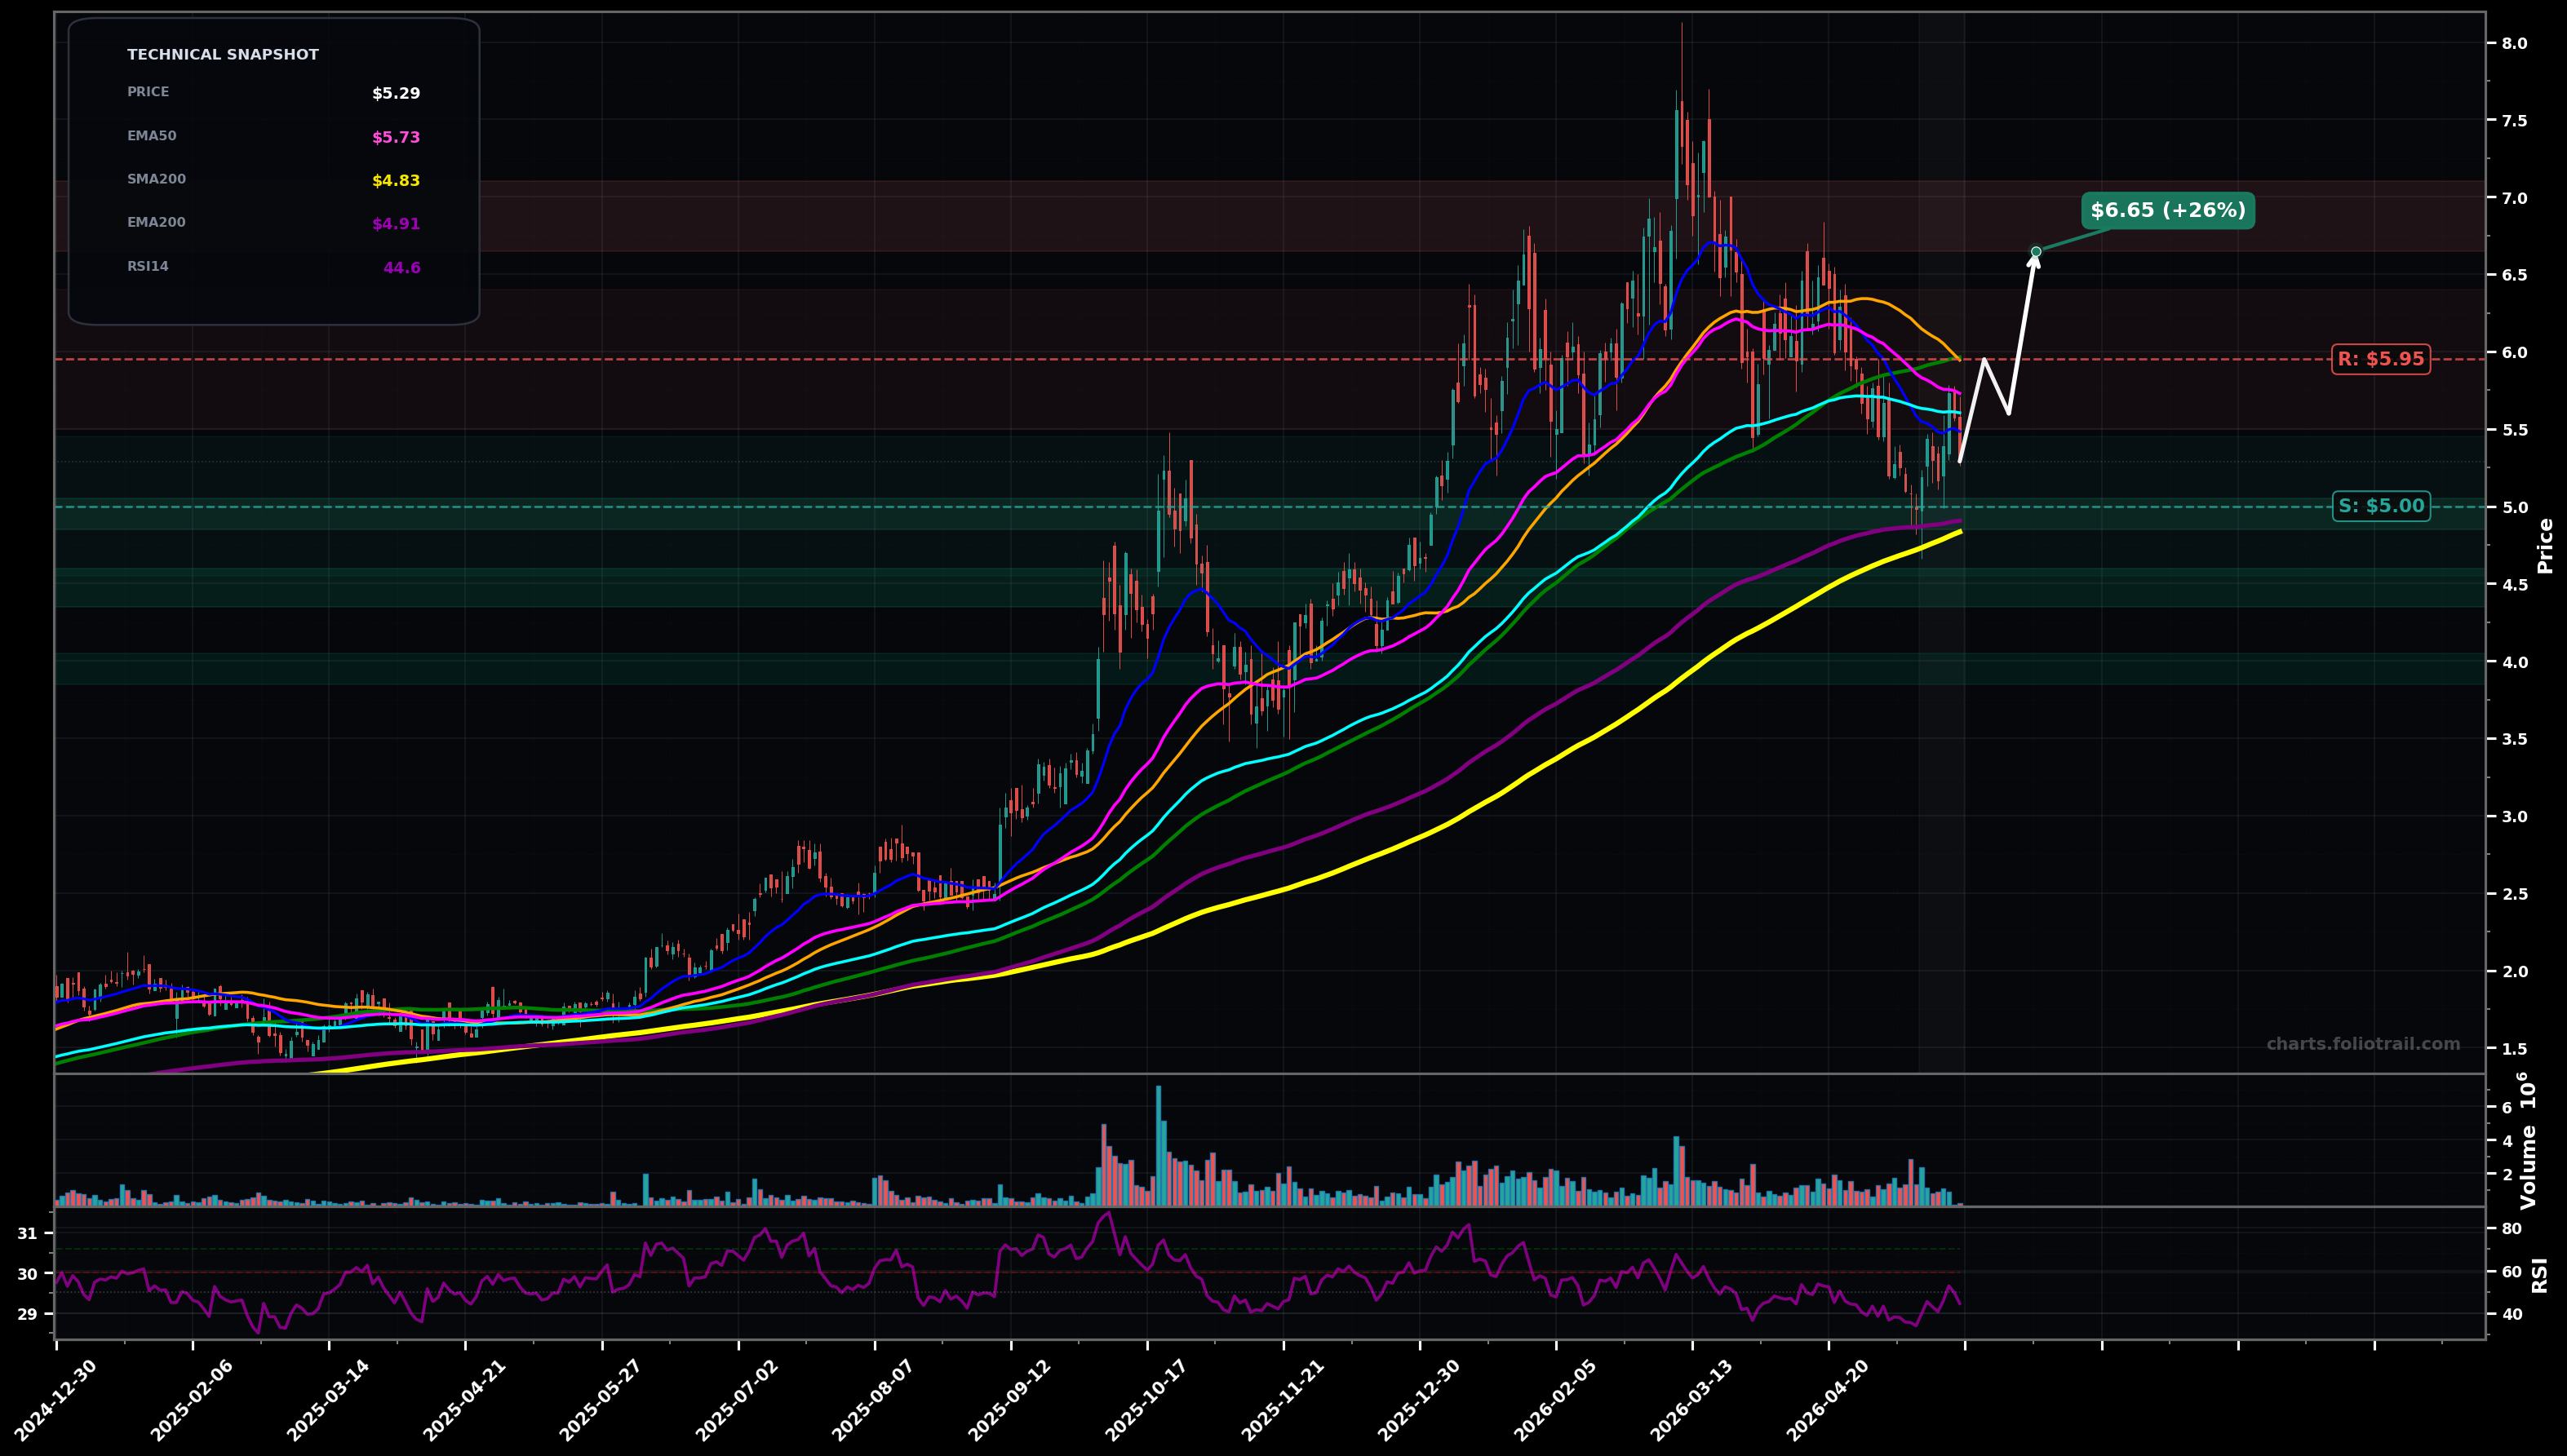
As of May 22, 2026, KRKNF (Kraken Robotics Inc.) is in a downtrend state on the daily chart, with a confidence level of 67%. Key support is at $5.00 and key resistance at $5.95. Price at $5.29 is chopping below the cluster of fast MAs (SMA50/100 and EMA50/100) after a sharp pullback from the ~$7.8 peak; RSI ~44 suggests weak momentum, not oversold.
Base-building between ~$5.00 support and ~$5.95 resistance, then a breakout-reclaim of the MA band; this would look like an Elliott Wave corrective structure completing (likely wave 4 or wave B) before attempting another push up.
Support fails and the pullback extends (corrective wave continues), likely mean-reverting toward the rising long-term averages; bearish continuation is favored if $5.00 breaks cleanly.
Daily close below $5.00 (break of the most recent swing-low support) with follow-through
Two daily closes above $5.95 (reclaim of SMA50/SMA100 band) holding above it
Start near swing-low support (~$5.00); add into EMA200/SMA200 region (~$4.9–$4.3) as mean-reversion support; heavy add only on deeper capitulation toward the next major base/round level (~$4.0).
Trim into prior supply zones from the last distribution area (~$6.7–$7.8); close on a full extension above prior highs where a wave-5 style overshoot becomes plausible and risk/reward degrades.
As of May 22, 2026, KRKNF (Kraken Robotics Inc.) is in a downtrend state on the daily chart with 67% confidence. Price at $5.29 is chopping below the cluster of fast MAs (SMA50/100 and EMA50/100) after a sharp pullback from the ~$7.8 peak; RSI ~44 suggests weak momentum, not oversold.
On the daily timeframe, KRKNF has key support at $5.00 and key resistance at $5.95. The most likely scenario (bullish) targets $5.95 and $6.65, with a revert level at $5.60.
KRKNF (Kraken Robotics Inc.) is currently classified as downtrend on the daily chart, with 67% confidence. Confirmation requires: Daily close below $5.00 (break of the most recent swing-low support) with follow-through This would be invalidated by: Two daily closes above $5.95 (reclaim of SMA50/SMA100 band) holding above it
The most likely scenario (bullish) targets $5.95 and $6.65, with a revert level at $5.60. The alternative scenario (bearish) targets $4.90 and $4.35.
Multi-layer AI agents analyse 200+ stocks across daily, weekly, and monthly timeframes — producing market state classifications, price scenarios with targets, and position entry/exit levels. Daily charts updated every trading day at 6 PM ET. Weekly charts refresh Fridays. Monthly charts refresh on the last trading day of each month. No paywall. No sign-up required.
Built by Foliotrail.
All content on this website — including charts, analysis, price targets, support/resistance levels, and position zones — is generated entirely by AI and provided for educational and informational purposes only.
This is not financial advice. NEXUSNOIR VENTURES SL (the operator of this website) is not a registered investment adviser or broker-dealer. You should not make investment decisions based solely on this information. Always do your own research and consult a qualified financial advisor.
By continuing, you acknowledge that you have read and agree to our full disclaimer & terms of use and privacy policy.