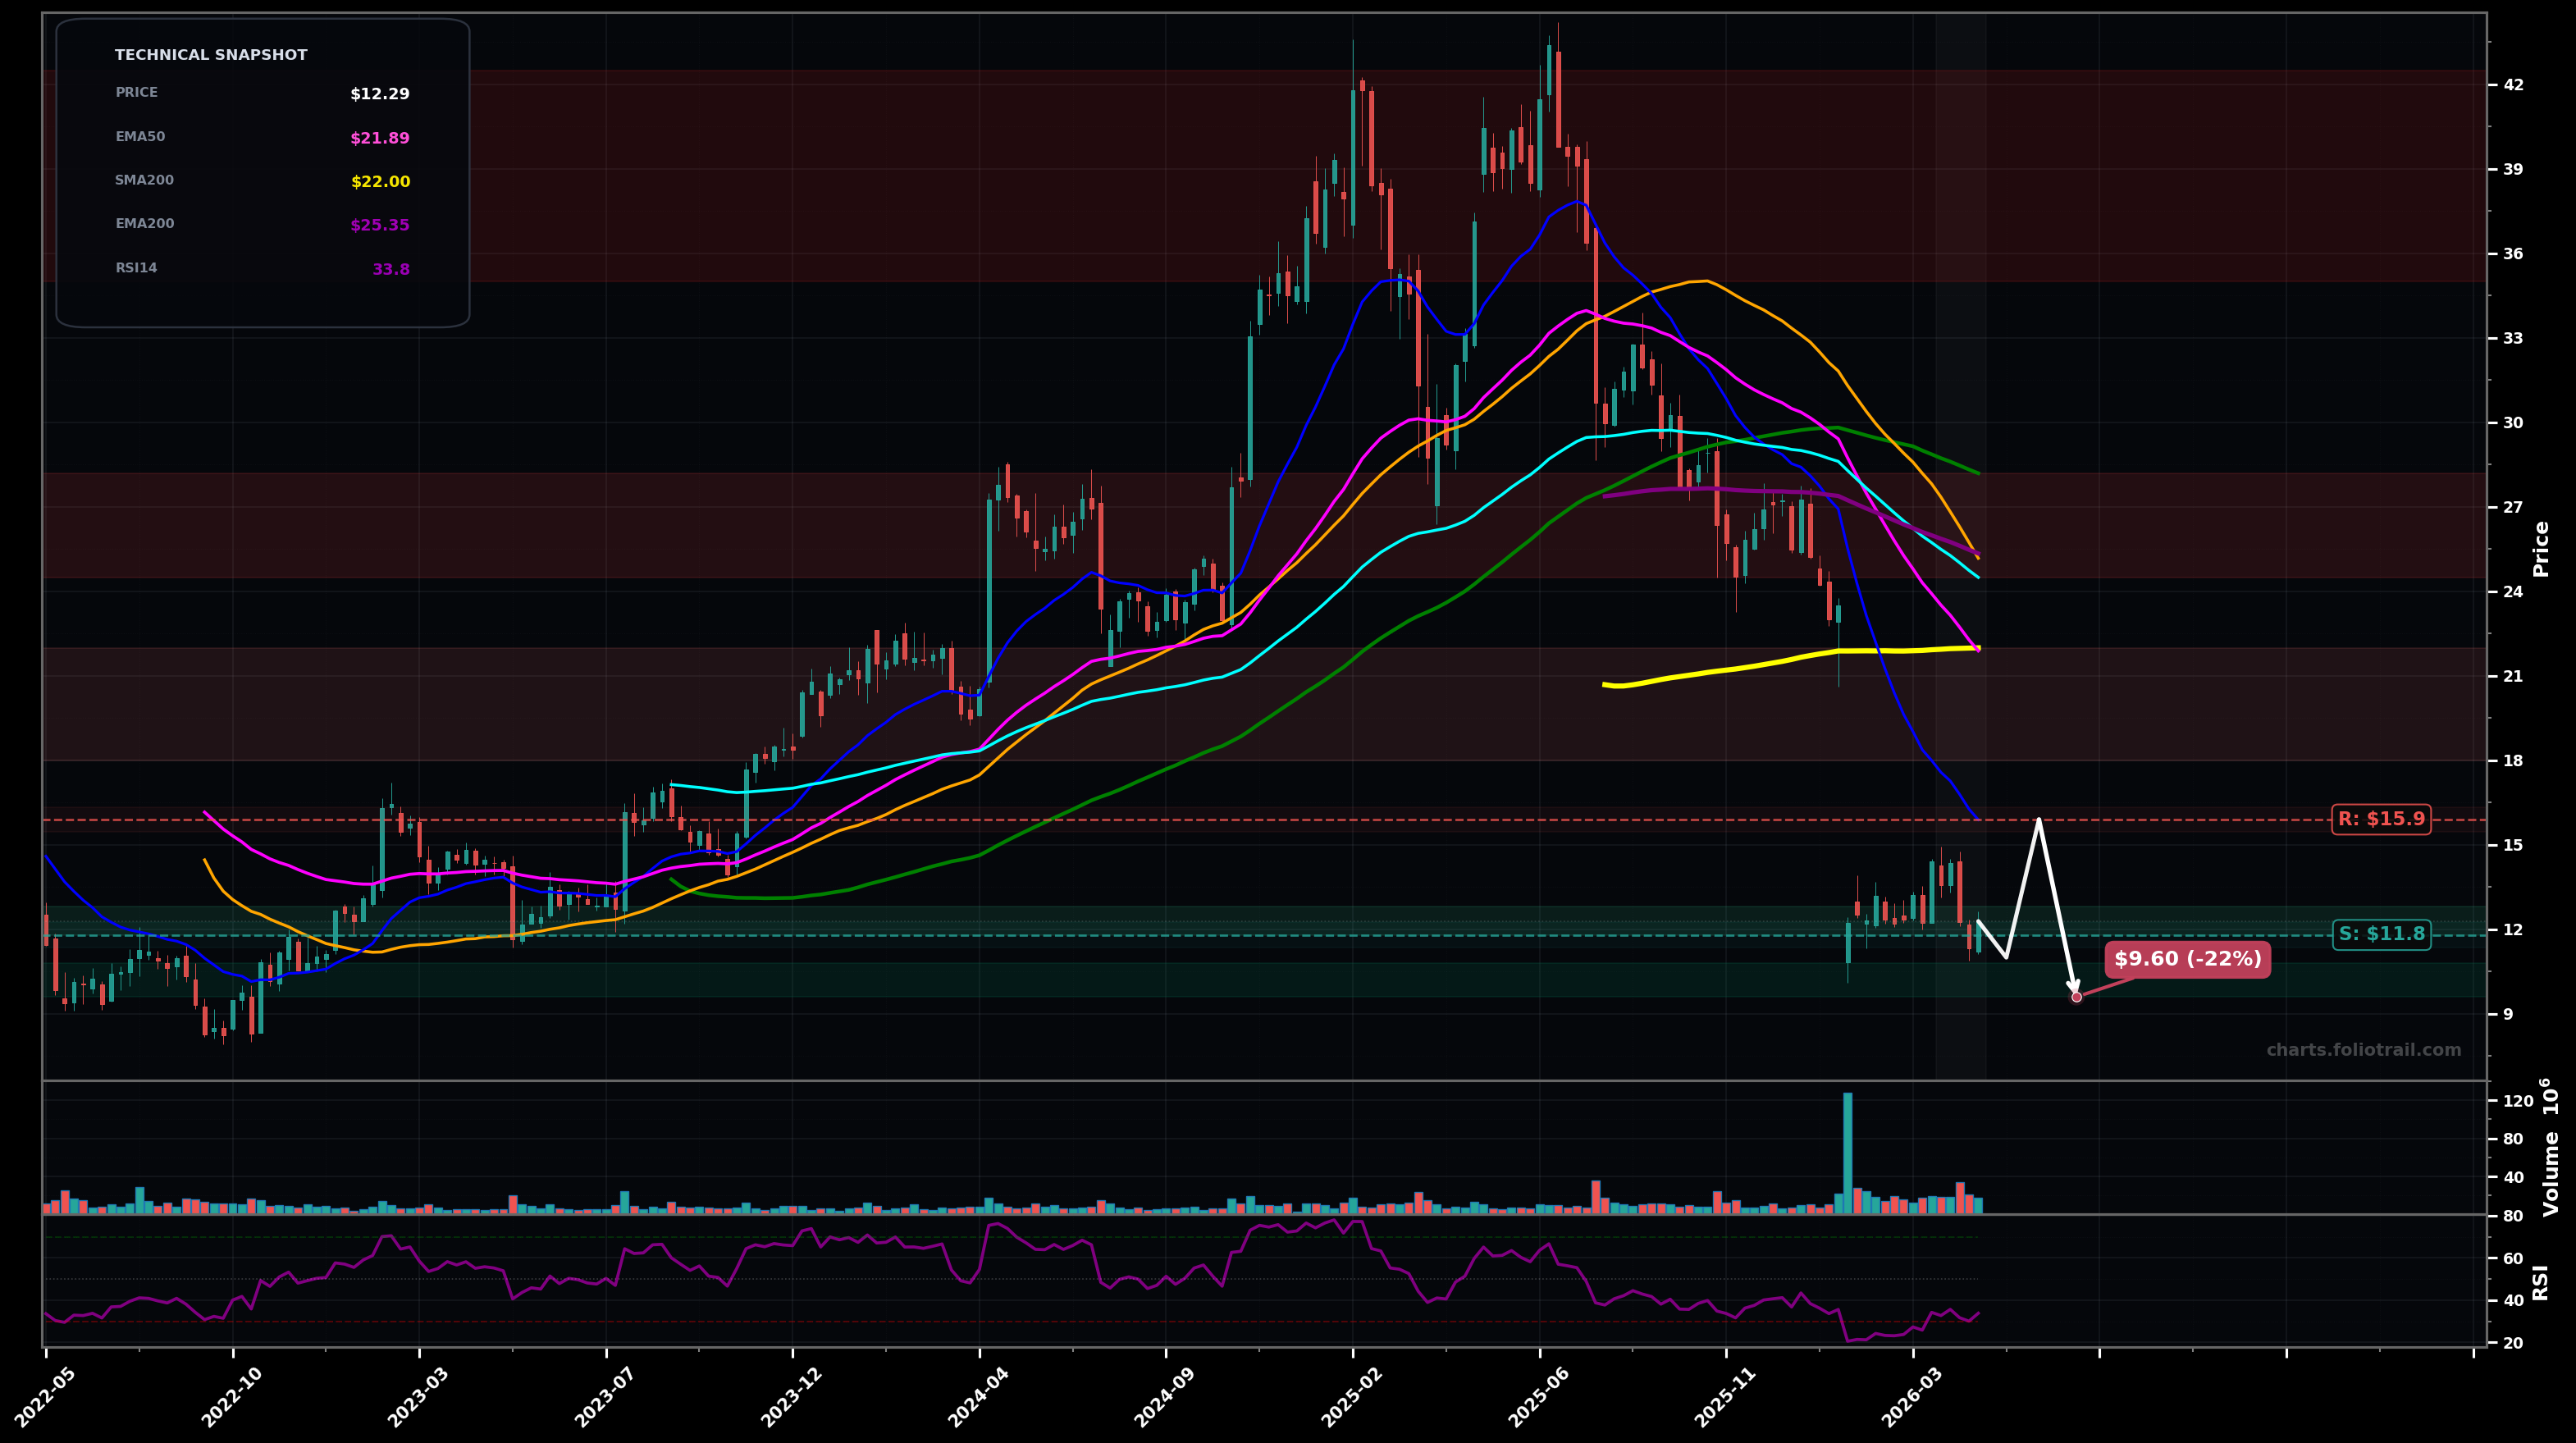
As of May 22, 2026, KD (Kyndryl Holdings Inc.) is in a falling knife state on the weekly chart, with a confidence level of 78%. Key support is at $11.8 and key resistance at $15.9. Weekly downtrend with a recent high-volume selloff into the $11–$13 area; price ($12.29) is far below all key EMAs/SMAs and momentum (RSI ~33.8) is weak but not fully washed out.
Bearish continuation / basing attempt: price chops between $11.80 support and $15.90 (EMA20) with a possible sweep under $11.80, then tries to build a higher low; any bounce likely stalls at the $15.90–$17.50 supply zone before another test of lows.
Mean-reversion rally: sellers exhaust, price forms a weekly higher low above ~$11.80 and pushes back toward the first cluster of moving averages; a corrective rally targets the prior breakdown area near ~$18 then the EMA50 zone near ~$22.
Confirm FALLING_KNIFE if weekly closes remain below $15.90 (EMA20) for 2+ weeks
Invalidate if price reclaims and holds above $21.90 (EMA50) for 2 consecutive weekly closes
Layering around the current swing-low area with a lower add in case of a final capitulation flush; trend is down so entries are staged and size-controlled.
Trim into mean-reversion targets and MA clusters (EMA50/EMA100/SMA levels) where downtrend supply is likely; fully exit into prior-cycle resistance near the $35–$42 zone if reached.
As of May 22, 2026, KD (Kyndryl Holdings Inc.) is in a falling knife state on the weekly chart with 78% confidence. Weekly downtrend with a recent high-volume selloff into the $11–$13 area; price ($12.29) is far below all key EMAs/SMAs and momentum (RSI ~33.8) is weak but not fully washed out.
On the weekly timeframe, KD has key support at $11.8 and key resistance at $15.9. The most likely scenario (bearish) targets $11.0 and $9.60, with a revert level at $15.9.
KD (Kyndryl Holdings Inc.) is currently classified as falling knife on the weekly chart, with 78% confidence. Confirmation requires: Confirm FALLING_KNIFE if weekly closes remain below $15.90 (EMA20) for 2+ weeks This would be invalidated by: Invalidate if price reclaims and holds above $21.90 (EMA50) for 2 consecutive weekly closes
The most likely scenario (bearish) targets $11.0 and $9.60, with a revert level at $15.9. The alternative scenario (bullish) targets $18.0 and $22.0.
Multi-layer AI agents analyse 200+ stocks across daily, weekly, and monthly timeframes — producing market state classifications, price scenarios with targets, and position entry/exit levels. Daily charts updated every trading day at 6 PM ET. Weekly charts refresh Fridays. Monthly charts refresh on the last trading day of each month. No paywall. No sign-up required.
Built by Foliotrail.
All content on this website — including charts, analysis, price targets, support/resistance levels, and position zones — is generated entirely by AI and provided for educational and informational purposes only.
This is not financial advice. NEXUSNOIR VENTURES SL (the operator of this website) is not a registered investment adviser or broker-dealer. You should not make investment decisions based solely on this information. Always do your own research and consult a qualified financial advisor.
By continuing, you acknowledge that you have read and agree to our full disclaimer & terms of use and privacy policy.