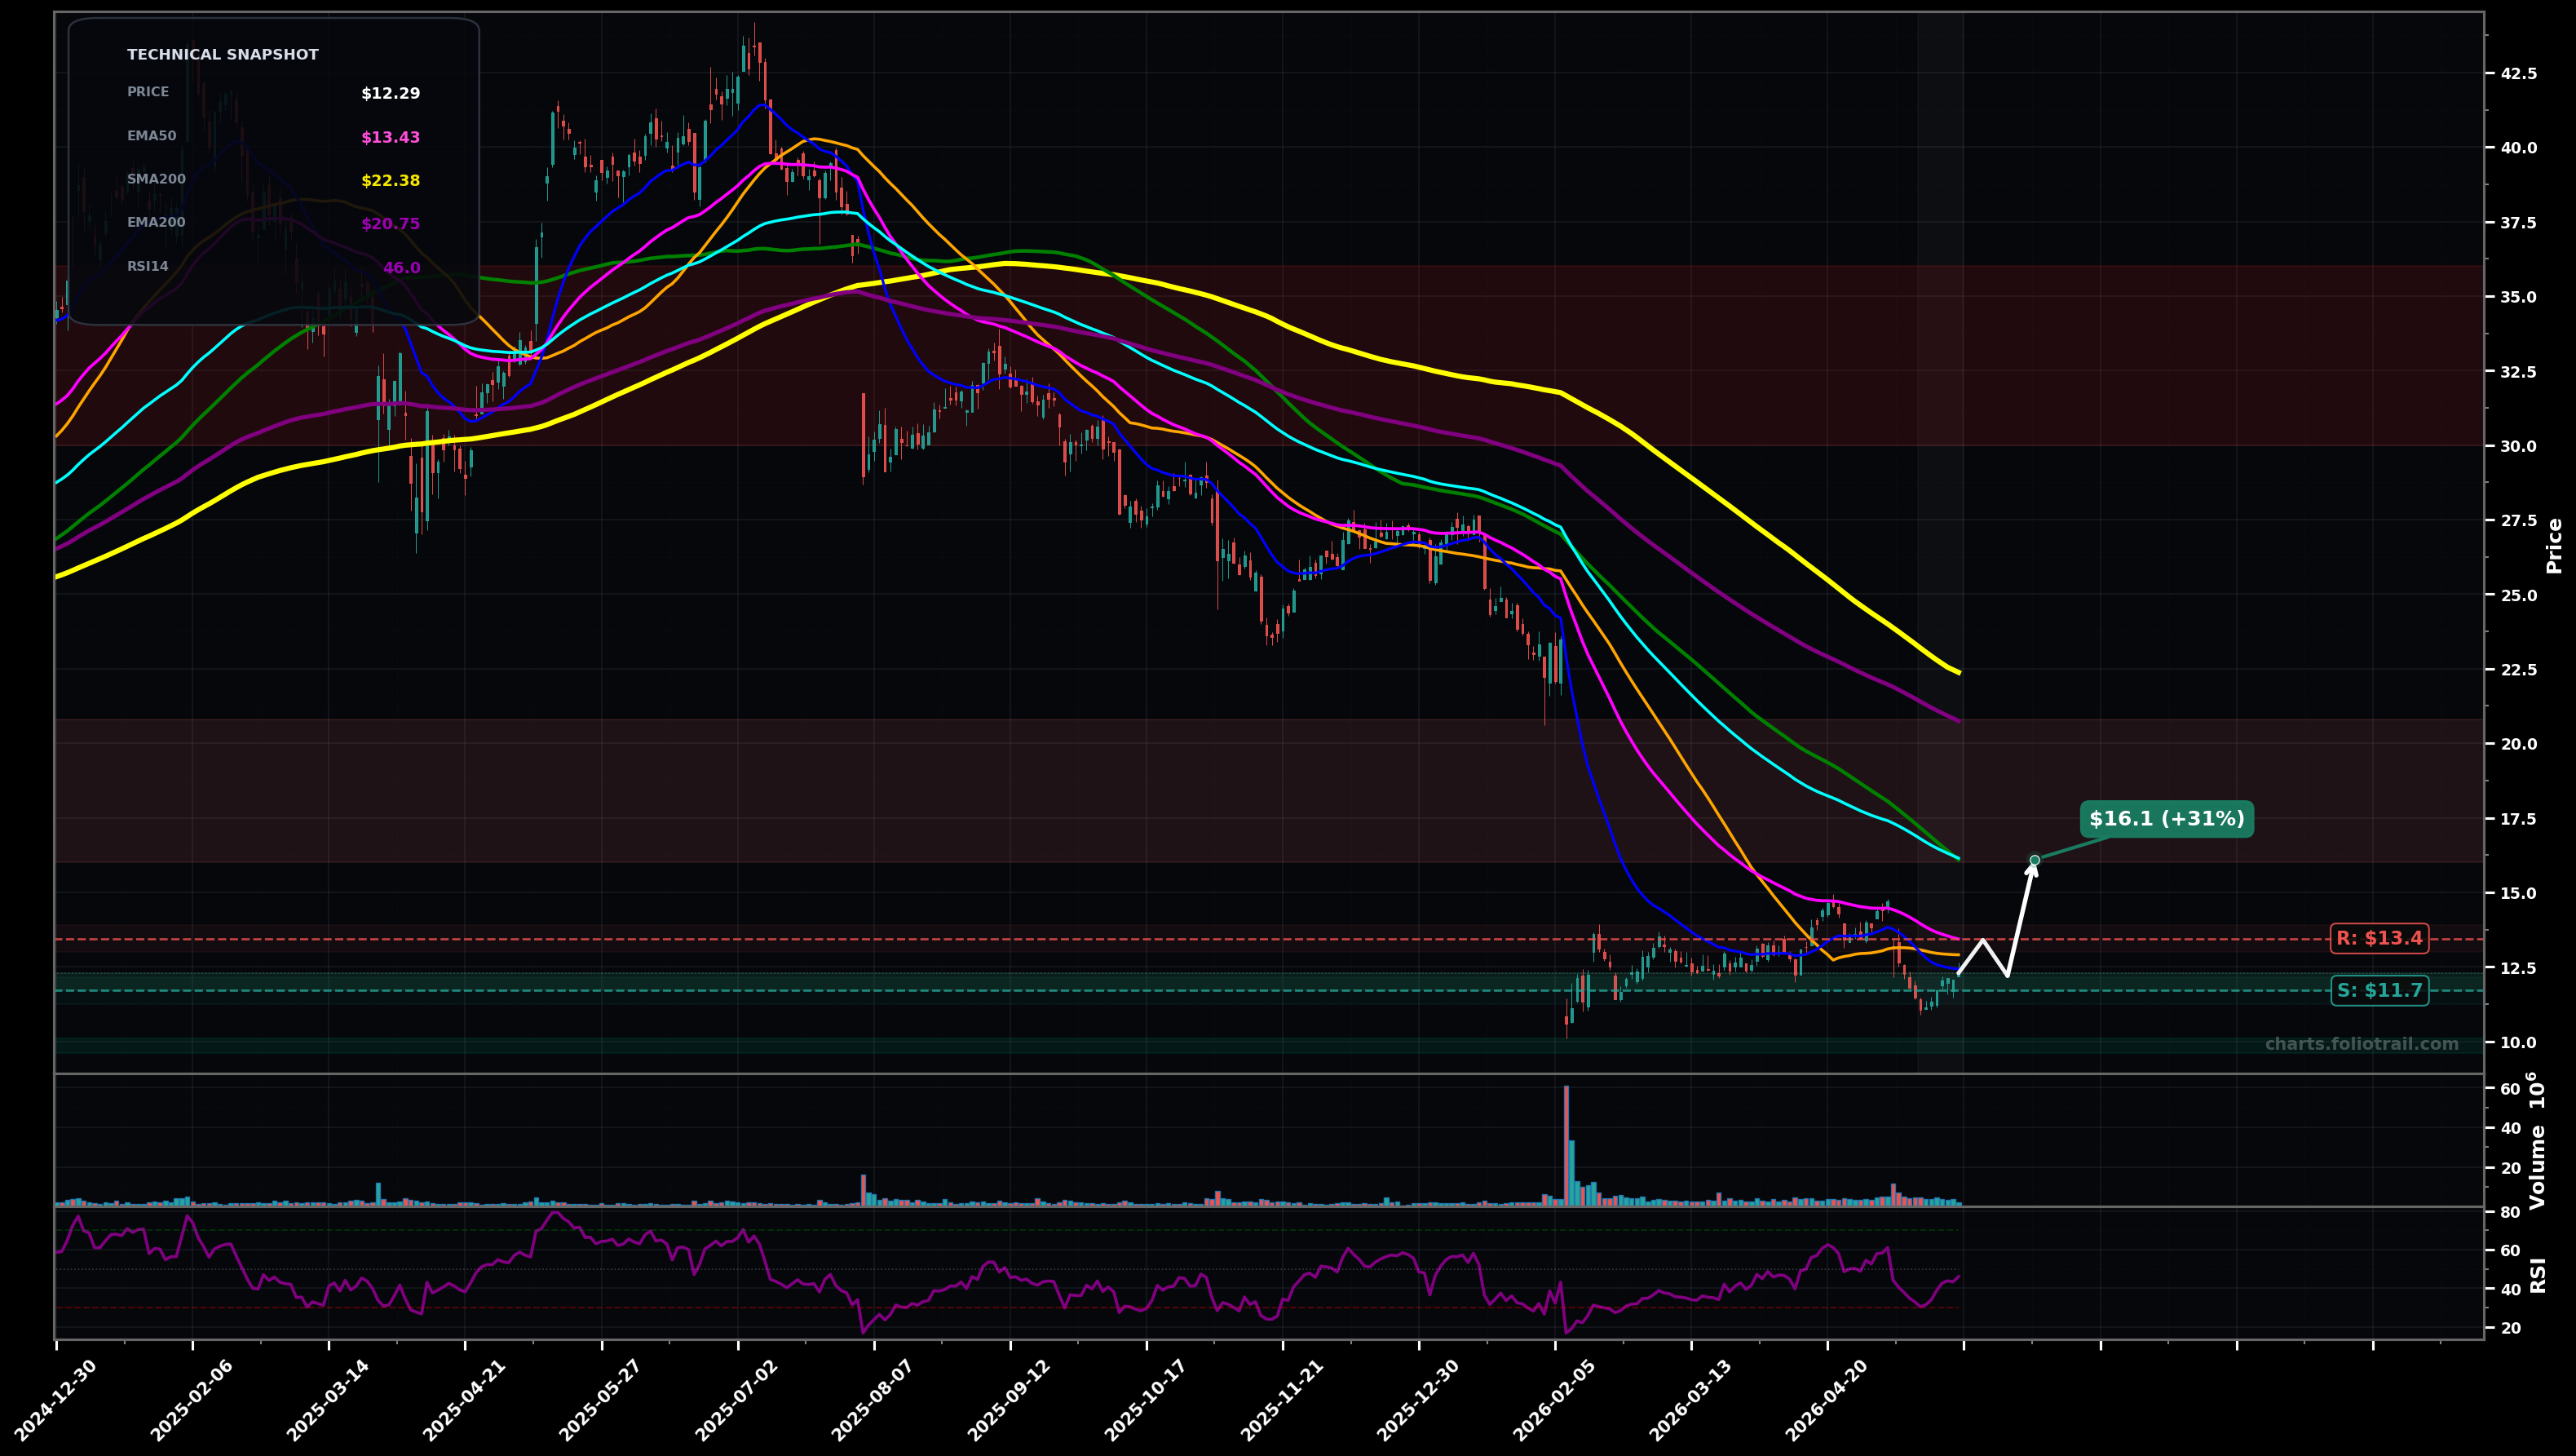
As of May 22, 2026, KD (Kyndryl Holdings Inc.) is in a bottoming attempt state on the daily chart, with a confidence level of 58%. Key support is at $11.7 and key resistance at $13.4. Price at ~$12.29 is basing after a sharp selloff; small rebound attempt but still below the $12.90 SMA50 and well below falling EMA50/EMA100; RSI ~46 suggests mild recovery from oversold without trend reversal.
Base continues: price grinds higher into the first moving-average cluster, likely stalling near EMA50/SMA50; pullback retests support, then another push attempts to reclaim SMA50/EMA50.
Bear continuation: rejection at the $13.4-$14 area rolls over; support breaks and price revisits the capitulation zone, potentially printing a fresh LL before any durable bottom.
2+ daily closes above $13.43 (EMA50) with a higher low holding above $11.70
Daily close below $11.40 (break of the recent swing-low base)
Accumulation zones are aligned with the current base support (~$11.7), the bearish invalidation/swing-low break (~$11.4), and the capitulation/round-number demand near ~$10.
Trim into major MA overhead supply (EMA100 ~$16.15, EMA200 ~$20.75) and prior breakdown regions; full exit only if a multi-year mean-reversion push approaches the larger resistance band near the falling long-term averages.
As of May 22, 2026, KD (Kyndryl Holdings Inc.) is in a bottoming attempt state on the daily chart with 58% confidence. Price at ~$12.29 is basing after a sharp selloff; small rebound attempt but still below the $12.90 SMA50 and well below falling EMA50/EMA100; RSI ~46 suggests mild recovery from oversold without trend reversal.
On the daily timeframe, KD has key support at $11.7 and key resistance at $13.4. The most likely scenario (bullish) targets $13.4 and $16.1, with a revert level at $12.2.
KD (Kyndryl Holdings Inc.) is currently classified as bottoming attempt on the daily chart, with 58% confidence. Confirmation requires: 2+ daily closes above $13.43 (EMA50) with a higher low holding above $11.70 This would be invalidated by: Daily close below $11.40 (break of the recent swing-low base)
The most likely scenario (bullish) targets $13.4 and $16.1, with a revert level at $12.2. The alternative scenario (bearish) targets $11.4 and $10.0.
Multi-layer AI agents analyse 200+ stocks across daily, weekly, and monthly timeframes — producing market state classifications, price scenarios with targets, and position entry/exit levels. Daily charts updated every trading day at 6 PM ET. Weekly charts refresh Fridays. Monthly charts refresh on the last trading day of each month. No paywall. No sign-up required.
Built by Foliotrail.
All content on this website — including charts, analysis, price targets, support/resistance levels, and position zones — is generated entirely by AI and provided for educational and informational purposes only.
This is not financial advice. NEXUSNOIR VENTURES SL (the operator of this website) is not a registered investment adviser or broker-dealer. You should not make investment decisions based solely on this information. Always do your own research and consult a qualified financial advisor.
By continuing, you acknowledge that you have read and agree to our full disclaimer & terms of use and privacy policy.