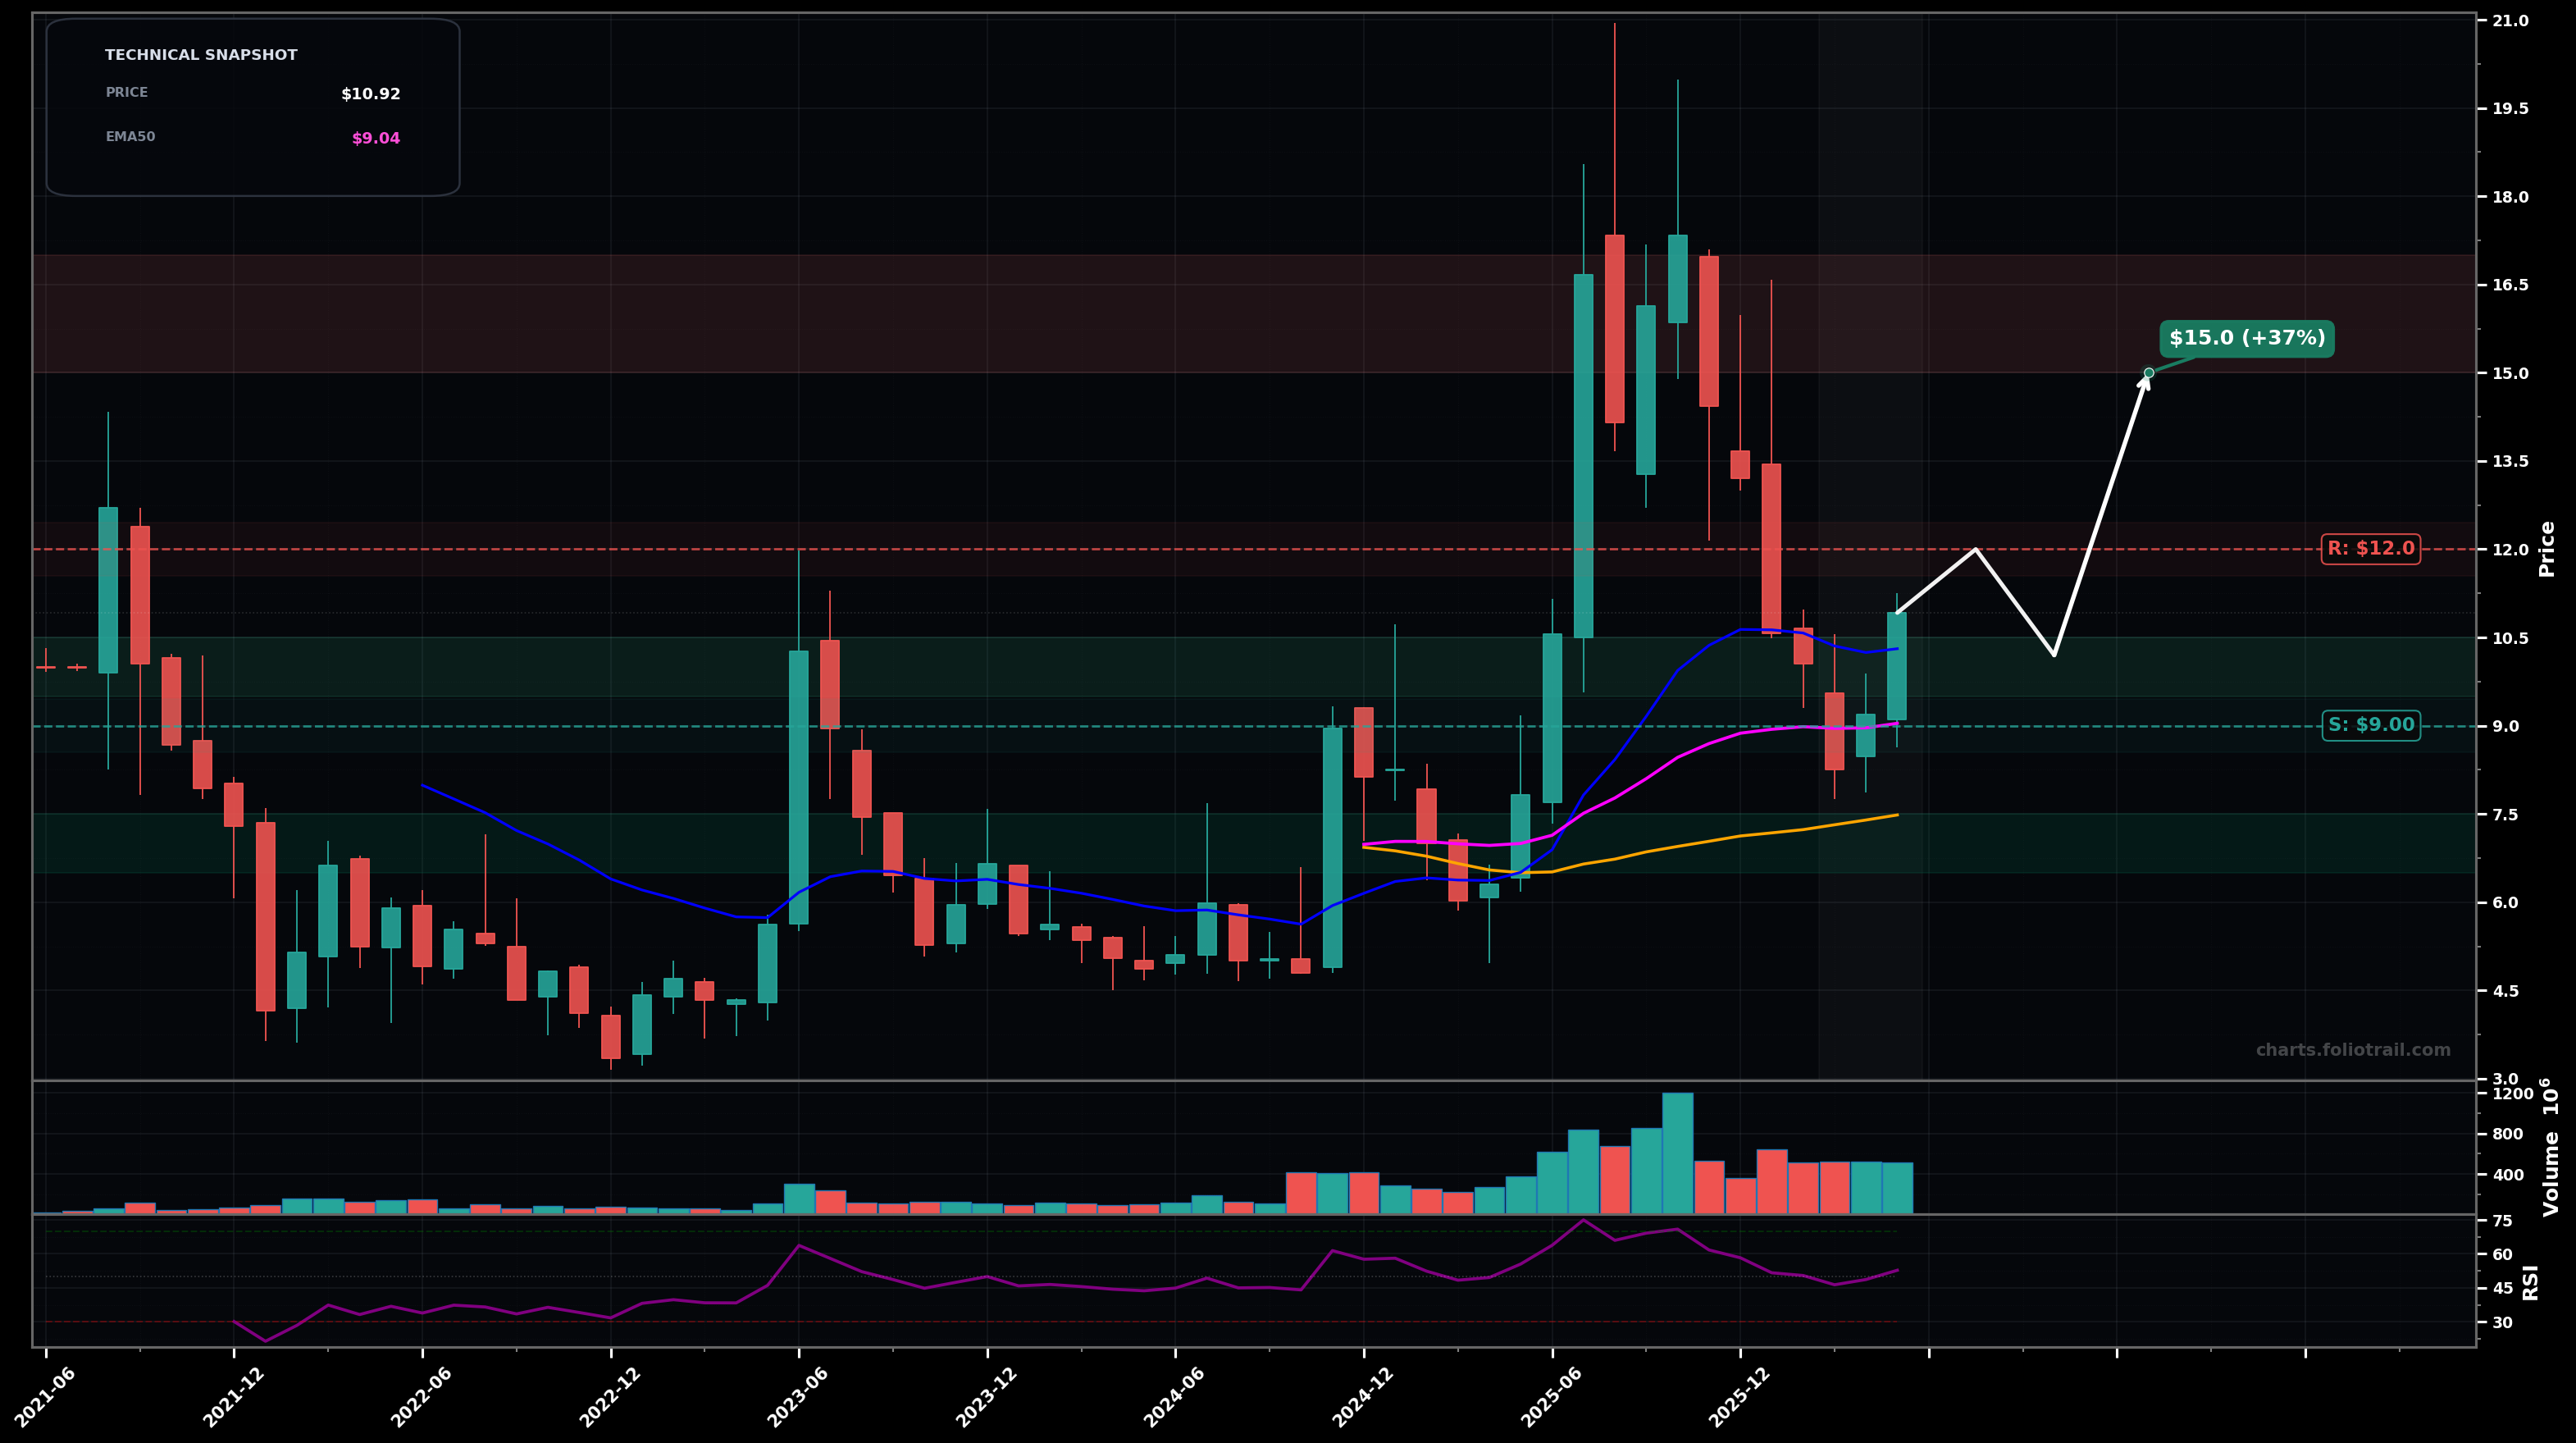
As of May 22, 2026, JOBY (Joby Aviation, Inc.) is in a choppy range state on the monthly chart, with a confidence level of 58%. Key support is at $9.00 and key resistance at $12.0. Monthly bounce back above the fast MAs after a pullback from the $20–$21 spike; last close around $10.92 with RSI ~53 (neutral) and volume still elevated vs prior base.
Range continuation with bullish bias: hold $9–$10 and grind higher; a break/hold over $12 opens a move toward the mid-teens (fib/previous congestion).
Bearish rejection: fail at ~$11–$12 and roll over back into the prior base; loss of $9 likely triggers a deeper retrace toward the long base area.
2+ monthly closes holding above $12.00
Monthly close below $9.00
Start near EMA50/EMA20 cluster; add on support retest ($9) or fib pullback; heavy add only if capitulation-type drop returns price to the prior multi-month base.
Trim into prior supply/fib extension zones (mid-teens then ~$20–$21 prior peak); fully close on a renewed euphoric extension above the previous blow-off high.
As of May 22, 2026, JOBY (Joby Aviation, Inc.) is in a choppy range state on the monthly chart with 58% confidence. Monthly bounce back above the fast MAs after a pullback from the $20–$21 spike; last close around $10.92 with RSI ~53 (neutral) and volume still elevated vs prior base.
On the monthly timeframe, JOBY has key support at $9.00 and key resistance at $12.0. The most likely scenario (bullish) targets $12.0 and $15.0, with a revert level at $10.2.
JOBY (Joby Aviation, Inc.) is currently classified as choppy range on the monthly chart, with 58% confidence. Confirmation requires: 2+ monthly closes holding above $12.00 This would be invalidated by: Monthly close below $9.00
The most likely scenario (bullish) targets $12.0 and $15.0, with a revert level at $10.2. The alternative scenario (bearish) targets $8.00 and $6.50.
Multi-layer AI agents analyse 200+ stocks across daily, weekly, and monthly timeframes — producing market state classifications, price scenarios with targets, and position entry/exit levels. Daily charts updated every trading day at 6 PM ET. Weekly charts refresh Fridays. Monthly charts refresh on the last trading day of each month. No paywall. No sign-up required.
Built by Foliotrail.
All content on this website — including charts, analysis, price targets, support/resistance levels, and position zones — is generated entirely by AI and provided for educational and informational purposes only.
This is not financial advice. NEXUSNOIR VENTURES SL (the operator of this website) is not a registered investment adviser or broker-dealer. You should not make investment decisions based solely on this information. Always do your own research and consult a qualified financial advisor.
By continuing, you acknowledge that you have read and agree to our full disclaimer & terms of use and privacy policy.