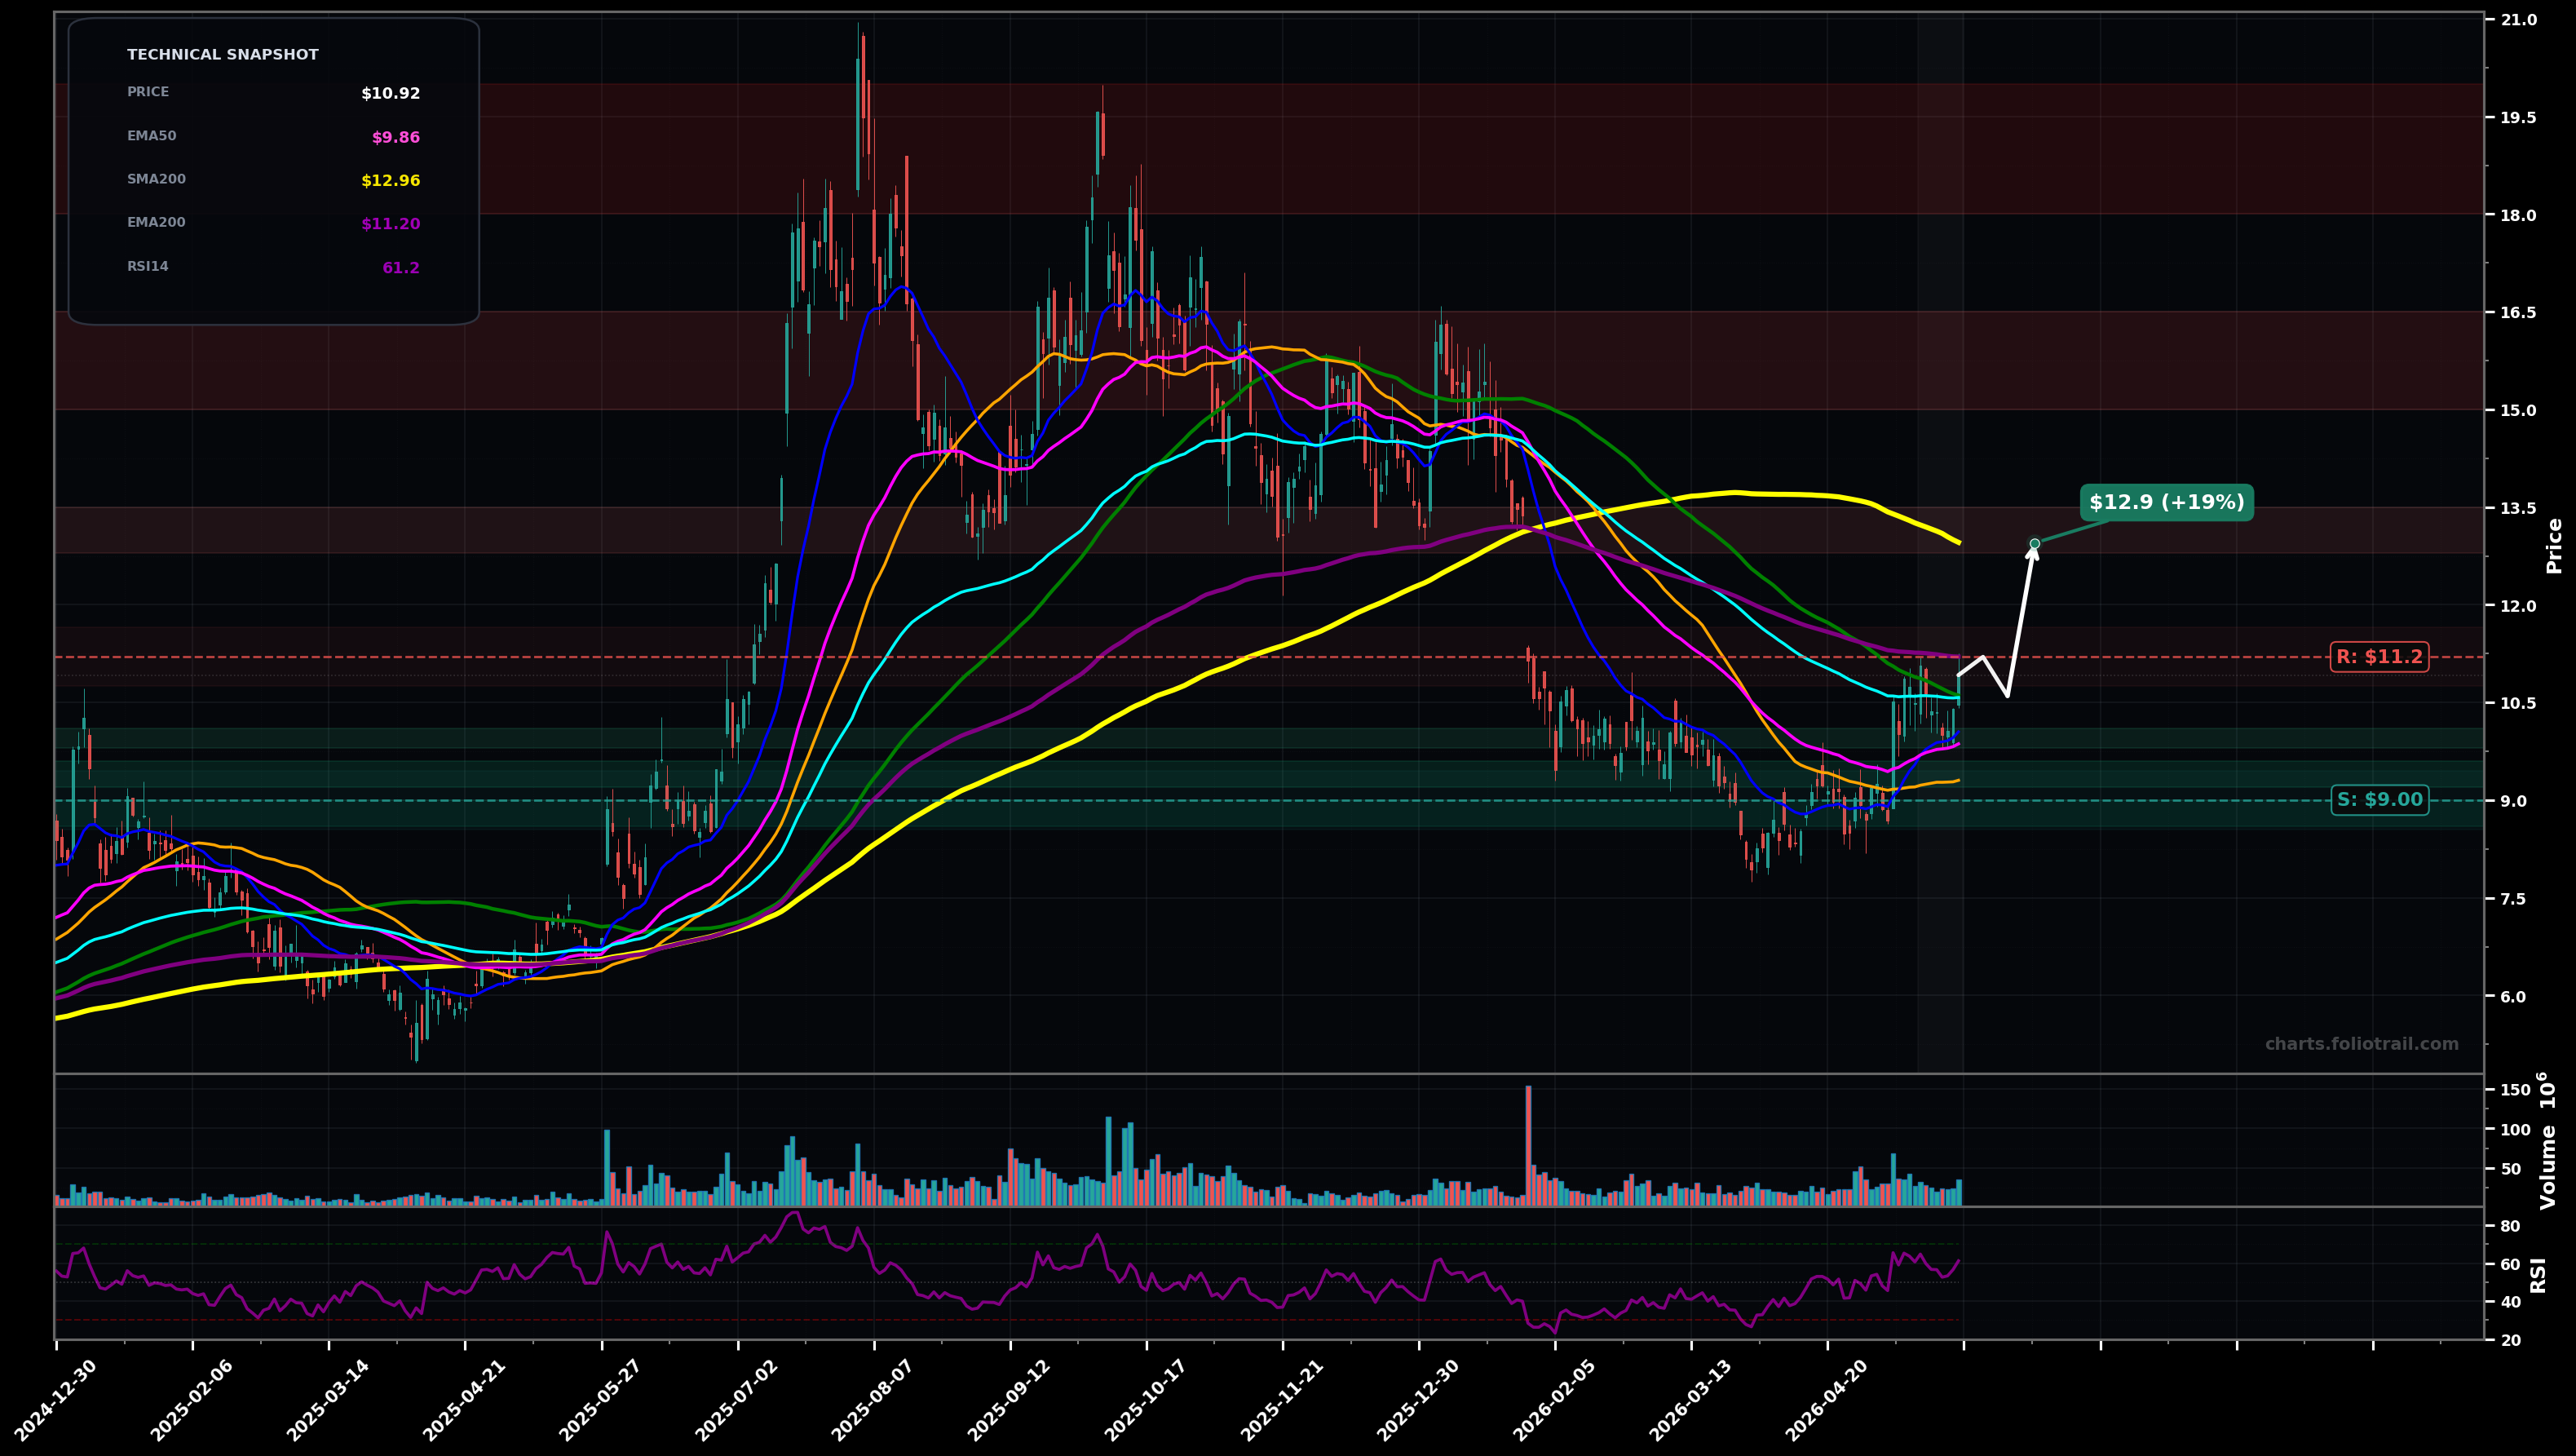
As of May 22, 2026, JOBY (Joby Aviation, Inc.) is in a bottoming attempt state on the daily chart, with a confidence level of 64%. Key support is at $9.00 and key resistance at $11.2. Sharp rebound off ~$8.6–$9.0 base; price now ~$10.92, reclaiming EMA50 (~$9.86) and SMA100 (~$10.61) but still below EMA100 (~$10.58) and EMA200 (~$11.20)/SMA200 (~$12.96) overhead zone; RSI ~61 shows improving momentum.
Base-to-reversal continuation: price consolidates above $10.60–$10.00, then grinds through $11.20 and targets the $12.95–$13.00 (SMA200 / prior supply) zone.
Failed reclaim: rejection at $11.20 leads to a pullback to retest the base/MAs; if $9.00 gives way, price revisits the ~$8.60 swing-low area (and potentially lower).
Daily close hold above $11.20 (EMA200) for 2+ sessions
Daily close below $9.00 (breaks the base support / recent swing structure)
Entries are built around the EMA50 reclaim area (~$9.86) with adds on a controlled pullback to the base and heavy adds at the swing-low support ($8.6–$9.0) where the bottoming attempt fails/holds.
Trim into major overhead MAs/supply (SMA200 near ~$13), then prior distribution zones ~$15–$16.5; fully exit into the prior peak supply area ~$18–$20 where upside becomes structurally stretched vs the base.
As of May 22, 2026, JOBY (Joby Aviation, Inc.) is in a bottoming attempt state on the daily chart with 64% confidence. Sharp rebound off ~$8.6–$9.0 base; price now ~$10.92, reclaiming EMA50 (~$9.86) and SMA100 (~$10.61) but still below EMA100 (~$10.58) and EMA200 (~$11.20)/SMA200 (~$12.96) overhead zone; RSI ~61 shows improving momentum.
On the daily timeframe, JOBY has key support at $9.00 and key resistance at $11.2. The most likely scenario (bullish) targets $11.2 and $12.9, with a revert level at $10.6.
JOBY (Joby Aviation, Inc.) is currently classified as bottoming attempt on the daily chart, with 64% confidence. Confirmation requires: Daily close hold above $11.20 (EMA200) for 2+ sessions This would be invalidated by: Daily close below $9.00 (breaks the base support / recent swing structure)
The most likely scenario (bullish) targets $11.2 and $12.9, with a revert level at $10.6. The alternative scenario (bearish) targets $9.86 and $8.60.
Multi-layer AI agents analyse 200+ stocks across daily, weekly, and monthly timeframes — producing market state classifications, price scenarios with targets, and position entry/exit levels. Daily charts updated every trading day at 6 PM ET. Weekly charts refresh Fridays. Monthly charts refresh on the last trading day of each month. No paywall. No sign-up required.
Built by Foliotrail.
All content on this website — including charts, analysis, price targets, support/resistance levels, and position zones — is generated entirely by AI and provided for educational and informational purposes only.
This is not financial advice. NEXUSNOIR VENTURES SL (the operator of this website) is not a registered investment adviser or broker-dealer. You should not make investment decisions based solely on this information. Always do your own research and consult a qualified financial advisor.
By continuing, you acknowledge that you have read and agree to our full disclaimer & terms of use and privacy policy.