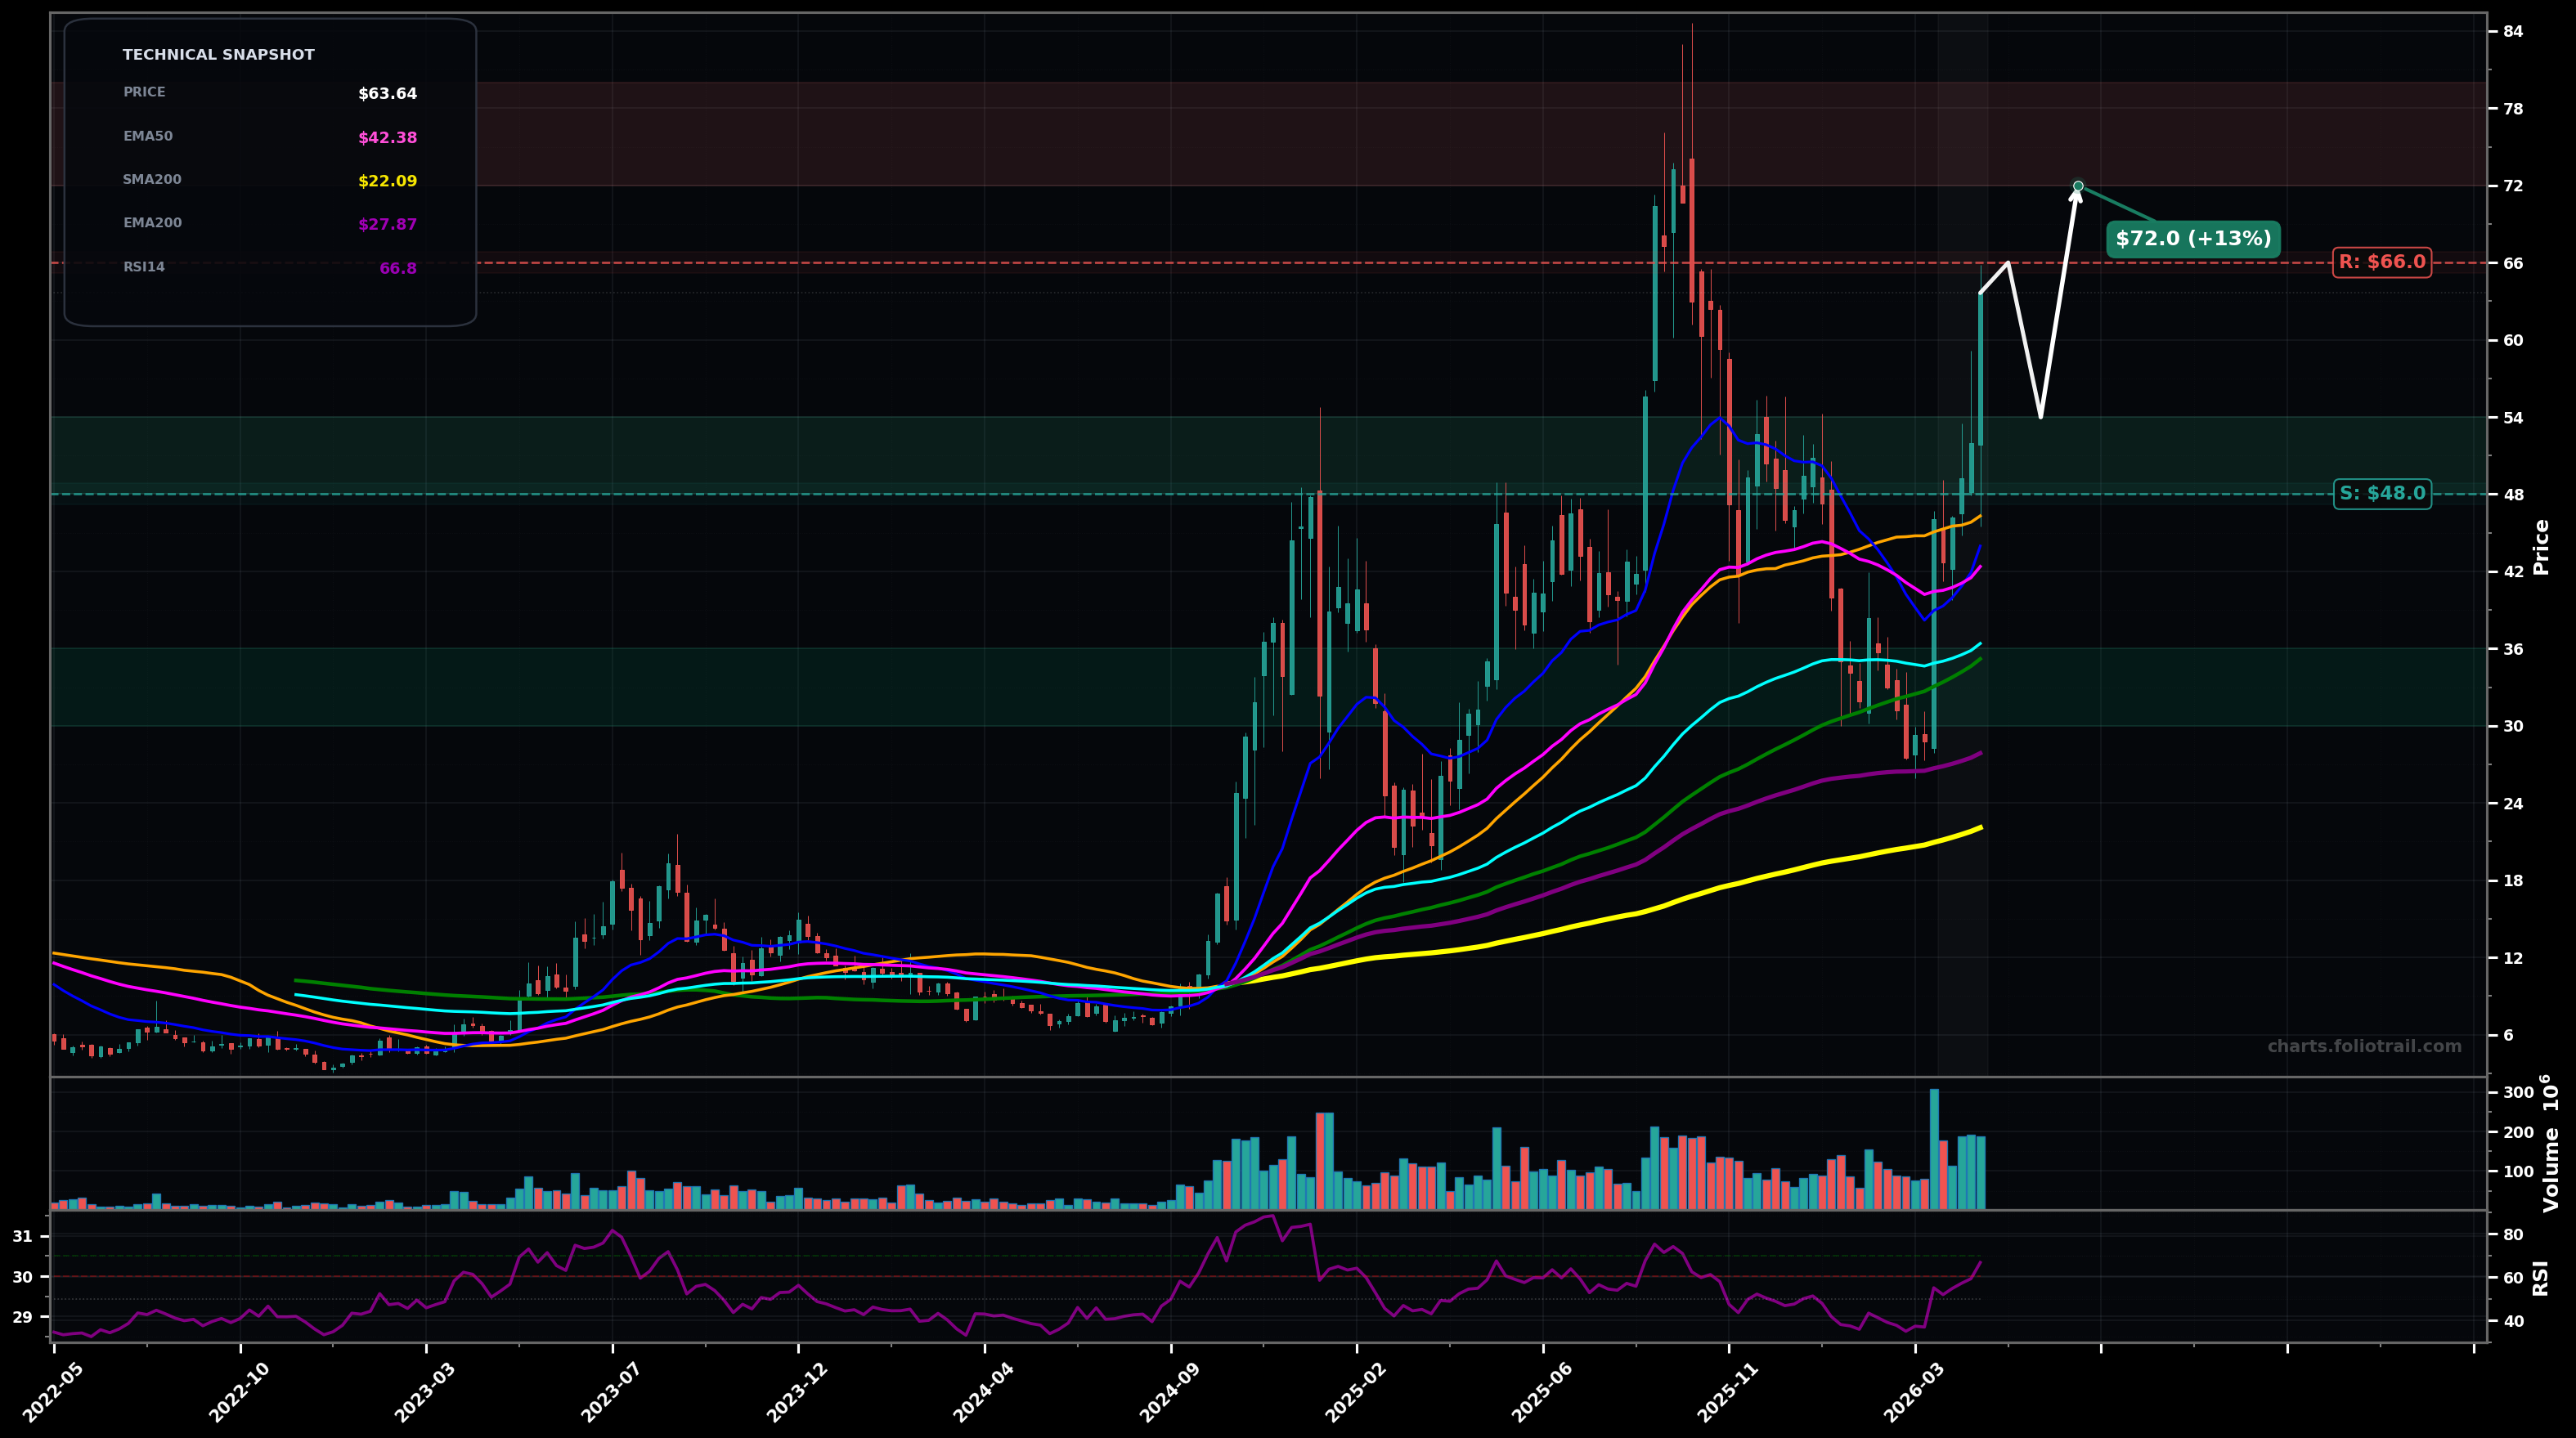
As of May 22, 2026, IONQ (IonQ, Inc.) is in a volatility expansion state on the weekly chart, with a confidence level of 72%. Key support is at $48.0 and key resistance at $66.0. Weekly breakout thrust to ~$63.64 with RSI ~66.8; price is extended above rising short/mid MAs after a V-shaped rebound from the ~$27-$30 area.
Bullish continuation: price digests the breakout (brief pullback/flag) then attempts to retest the prior supply zone near the mid-$60s and extend toward the 2025 peak area; Elliott view: likely Wave 3 resumption (or Wave C of an ABC rebound) after a Wave 2 pullback from the ~$80 top; Fib: $66-$72 aligns with typical 0.618-0.786 retrace of the ~$80->$27 leg.
Bearish mean-reversion: breakout fades and price retraces to the reclaimed MA cluster; Elliott view: current thrust is a late Wave B (or Wave 5 of a countertrend rally) that rolls into a corrective Wave C down; key is whether the chart can hold above EMA50/SMA50.
2 weekly closes holding above $60.00
Weekly close below $42.00 (loss of EMA50 zone)
Buy the first pullback to prior breakout/pivot support ($48-$54), add on EMA50/SMA50 retest ($42-$48), and only deploy heavily if price revisits the higher-timeframe base near EMA200/SMA100 region ($30-$36).
Trim into prior ATH supply ($72-$80), trim harder on an extension leg (likely Wave 5 blow-off) above ATH ($90-$105), and close on extreme multi-year overextension where price is far above all major MAs ($120-$150).
As of May 22, 2026, IONQ (IonQ, Inc.) is in a volatility expansion state on the weekly chart with 72% confidence. Weekly breakout thrust to ~$63.64 with RSI ~66.8; price is extended above rising short/mid MAs after a V-shaped rebound from the ~$27-$30 area.
On the weekly timeframe, IONQ has key support at $48.0 and key resistance at $66.0. The most likely scenario (bullish) targets $66.0 and $72.0, with a revert level at $54.0.
IONQ (IonQ, Inc.) is currently classified as volatility expansion on the weekly chart, with 72% confidence. Confirmation requires: 2 weekly closes holding above $60.00 This would be invalidated by: Weekly close below $42.00 (loss of EMA50 zone)
The most likely scenario (bullish) targets $66.0 and $72.0, with a revert level at $54.0. The alternative scenario (bearish) targets $48.0 and $42.0.
Multi-layer AI agents analyse 200+ stocks across daily, weekly, and monthly timeframes — producing market state classifications, price scenarios with targets, and position entry/exit levels. Daily charts updated every trading day at 6 PM ET. Weekly charts refresh Fridays. Monthly charts refresh on the last trading day of each month. No paywall. No sign-up required.
Built by Foliotrail.
All content on this website — including charts, analysis, price targets, support/resistance levels, and position zones — is generated entirely by AI and provided for educational and informational purposes only.
This is not financial advice. NEXUSNOIR VENTURES SL (the operator of this website) is not a registered investment adviser or broker-dealer. You should not make investment decisions based solely on this information. Always do your own research and consult a qualified financial advisor.
By continuing, you acknowledge that you have read and agree to our full disclaimer & terms of use and privacy policy.