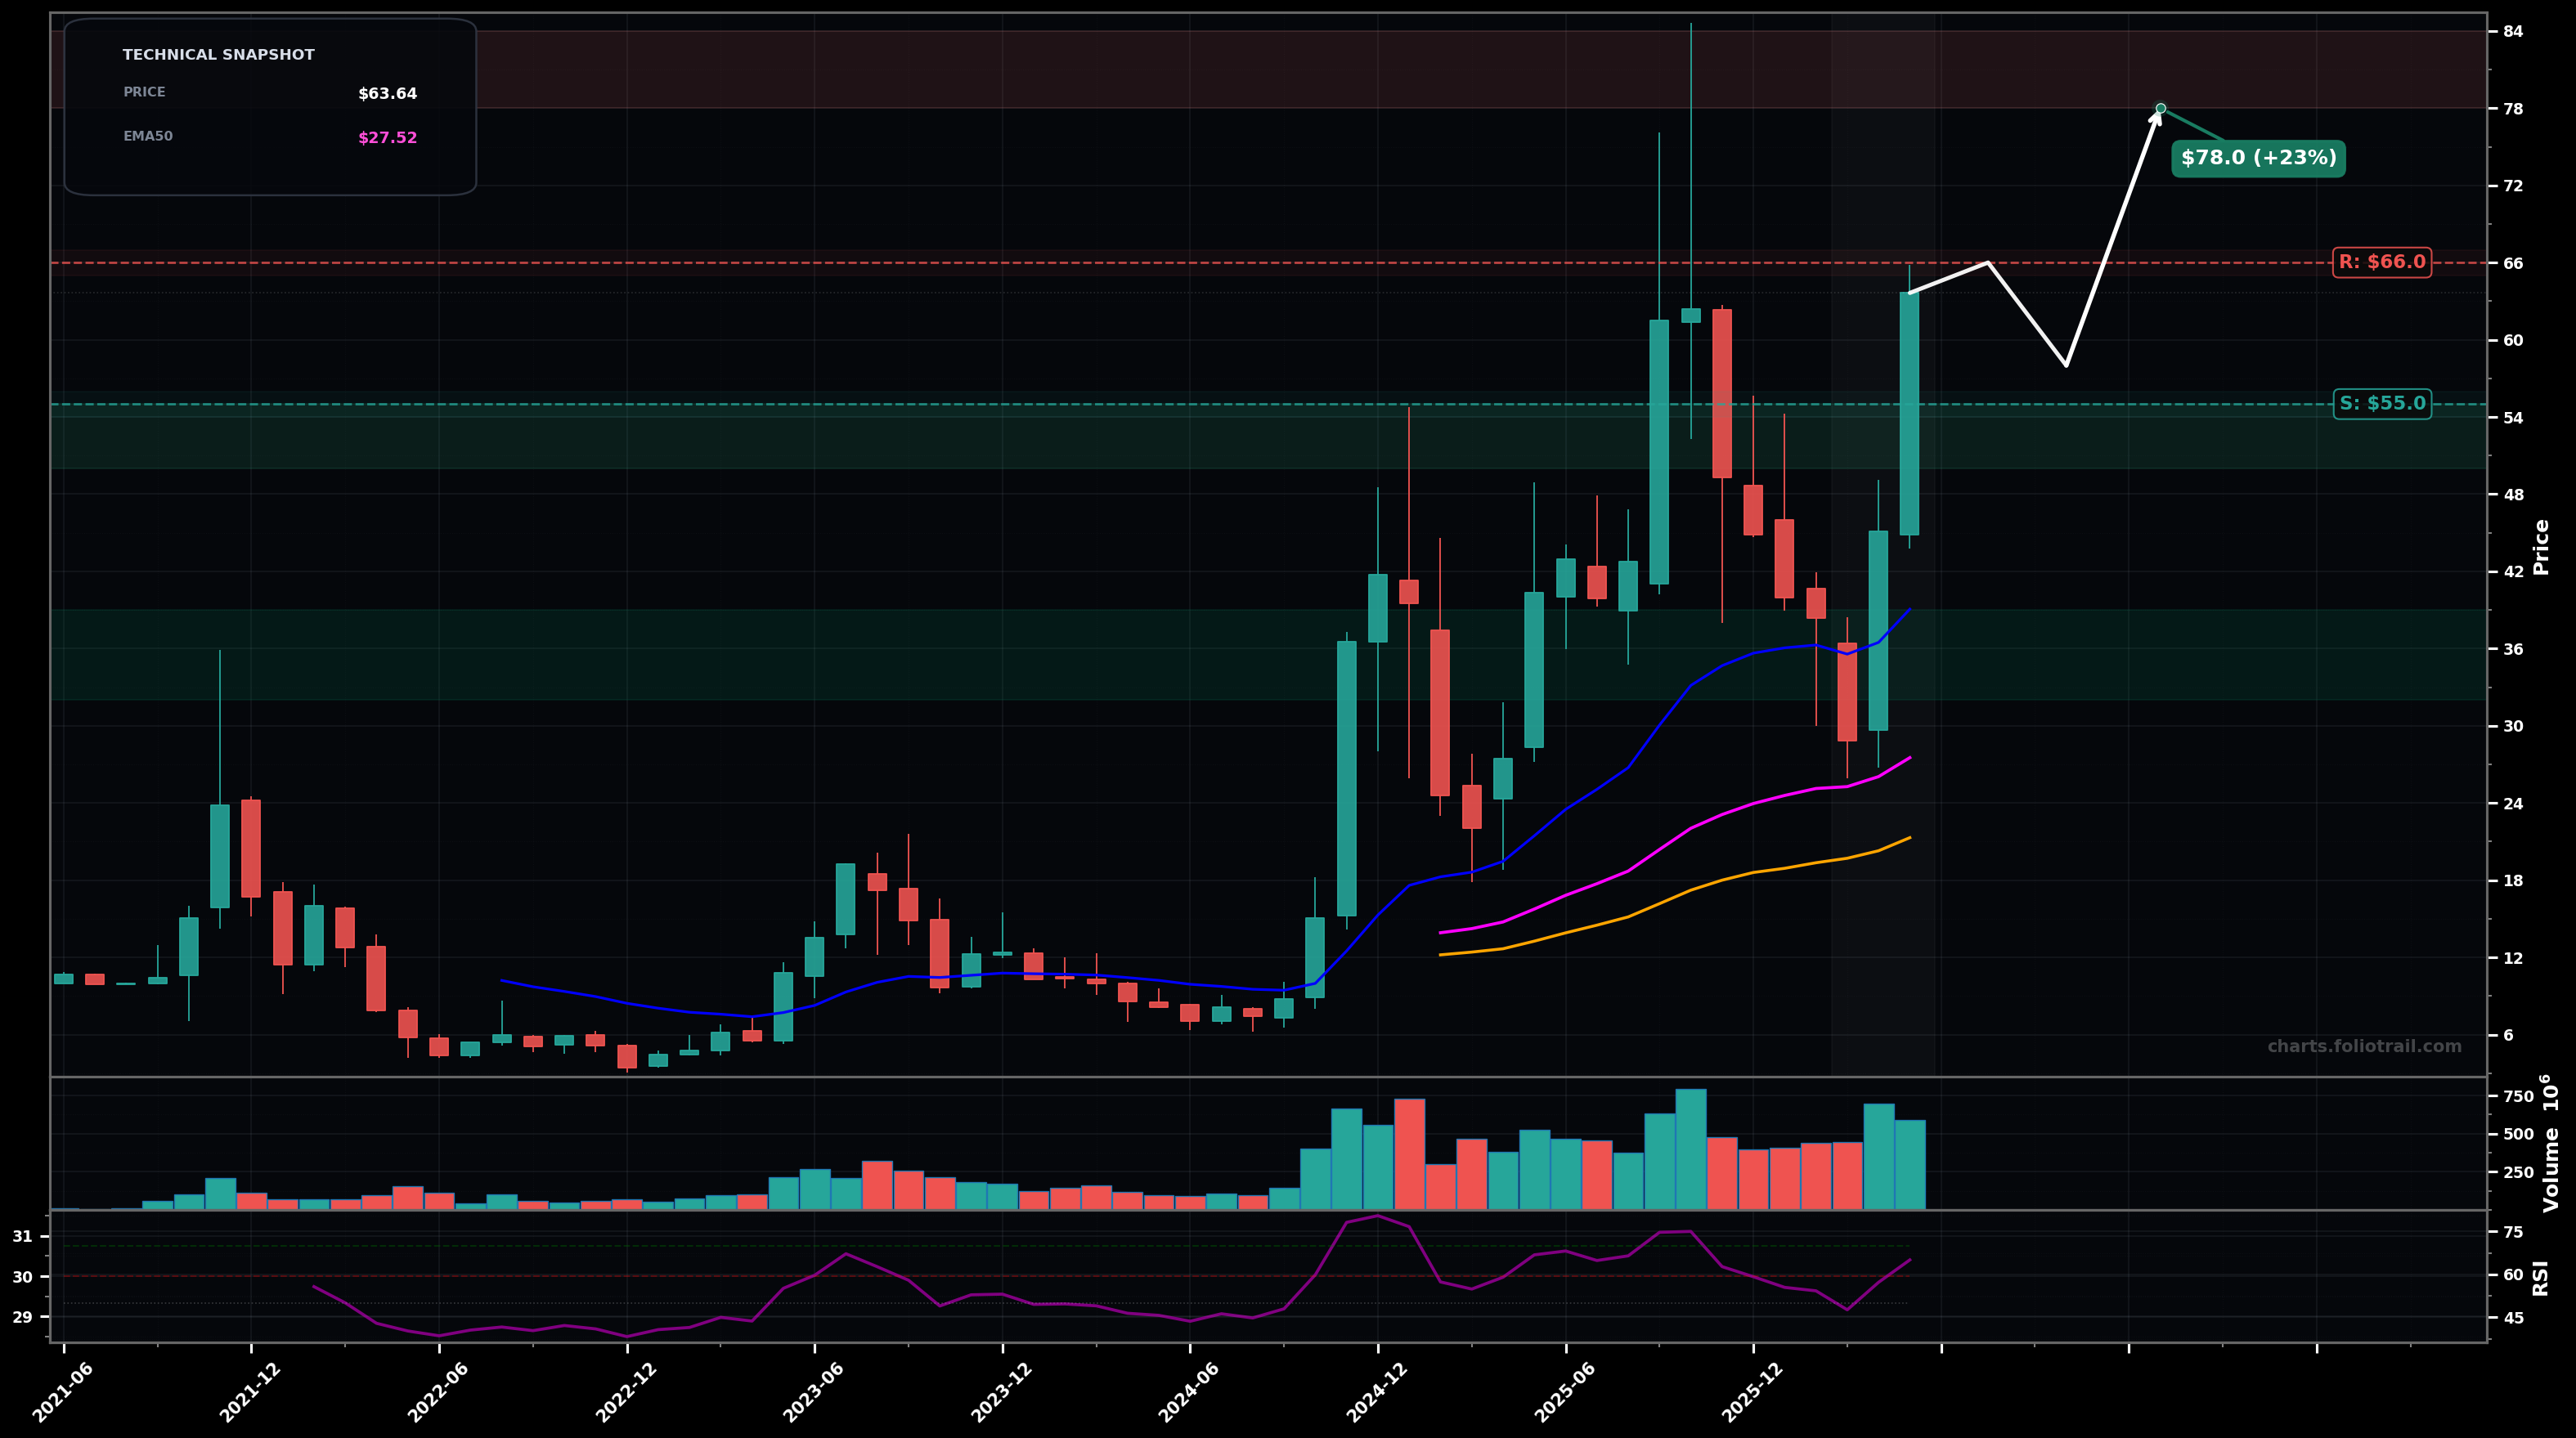
As of May 22, 2026, IONQ (IonQ, Inc.) is in a uptrend state on the monthly chart, with a confidence level of 72%. Key support is at $55.0 and key resistance at $66.0. Monthly rebound back to ~$63.64 after a sharp pullback into the rising EMA20 (~$39.06); strong green impulse candle suggests buyers defending the trend.
Bullish continuation: the recent bounce is likely the start of the next impulse leg (Elliott: wave 3/5 extension or wave 5) aiming to retest and then exceed the prior highs; Fibonacci-wise this looks like a pullback that held around the ~38.2–50% zone of the last major leg, favoring trend continuation.
Bearish deeper retrace: the bounce fails under prior supply and rolls over into a larger ABC correction (Elliott: wave 4 still unfolding) that revisits the mid-$40s and potentially the EMA50 region; this becomes more likely if a LH forms beneath $66 and momentum (RSI) slips back below ~55.
Hold 2+ monthly closes above $55 while making a HH above $66.
Monthly close below $39 (loss of EMA20 and last swing support).
Starter near reclaimed support ($55) with adds on Fibonacci pullback zones; heavy add only if price mean-reverts to EMA20 (~$39) / deeper correction while keeping the long-term uptrend thesis intact.
Trim into prior-high extensions/new highs (risk of monthly blow-off); heavier derisk on likely fib extensions (1.618+ of prior impulse), and close if a parabolic multi-year overshoot forms far above rising MAs.
As of May 22, 2026, IONQ (IonQ, Inc.) is in a uptrend state on the monthly chart with 72% confidence. Monthly rebound back to ~$63.64 after a sharp pullback into the rising EMA20 (~$39.06); strong green impulse candle suggests buyers defending the trend.
On the monthly timeframe, IONQ has key support at $55.0 and key resistance at $66.0. The most likely scenario (bullish) targets $66.0 and $78.0, with a revert level at $58.0.
IONQ (IonQ, Inc.) is currently classified as uptrend on the monthly chart, with 72% confidence. Confirmation requires: Hold 2+ monthly closes above $55 while making a HH above $66. This would be invalidated by: Monthly close below $39 (loss of EMA20 and last swing support).
The most likely scenario (bullish) targets $66.0 and $78.0, with a revert level at $58.0. The alternative scenario (bearish) targets $48.0 and $39.0.
Multi-layer AI agents analyse 200+ stocks across daily, weekly, and monthly timeframes — producing market state classifications, price scenarios with targets, and position entry/exit levels. Daily charts updated every trading day at 6 PM ET. Weekly charts refresh Fridays. Monthly charts refresh on the last trading day of each month. No paywall. No sign-up required.
Built by Foliotrail.
All content on this website — including charts, analysis, price targets, support/resistance levels, and position zones — is generated entirely by AI and provided for educational and informational purposes only.
This is not financial advice. NEXUSNOIR VENTURES SL (the operator of this website) is not a registered investment adviser or broker-dealer. You should not make investment decisions based solely on this information. Always do your own research and consult a qualified financial advisor.
By continuing, you acknowledge that you have read and agree to our full disclaimer & terms of use and privacy policy.