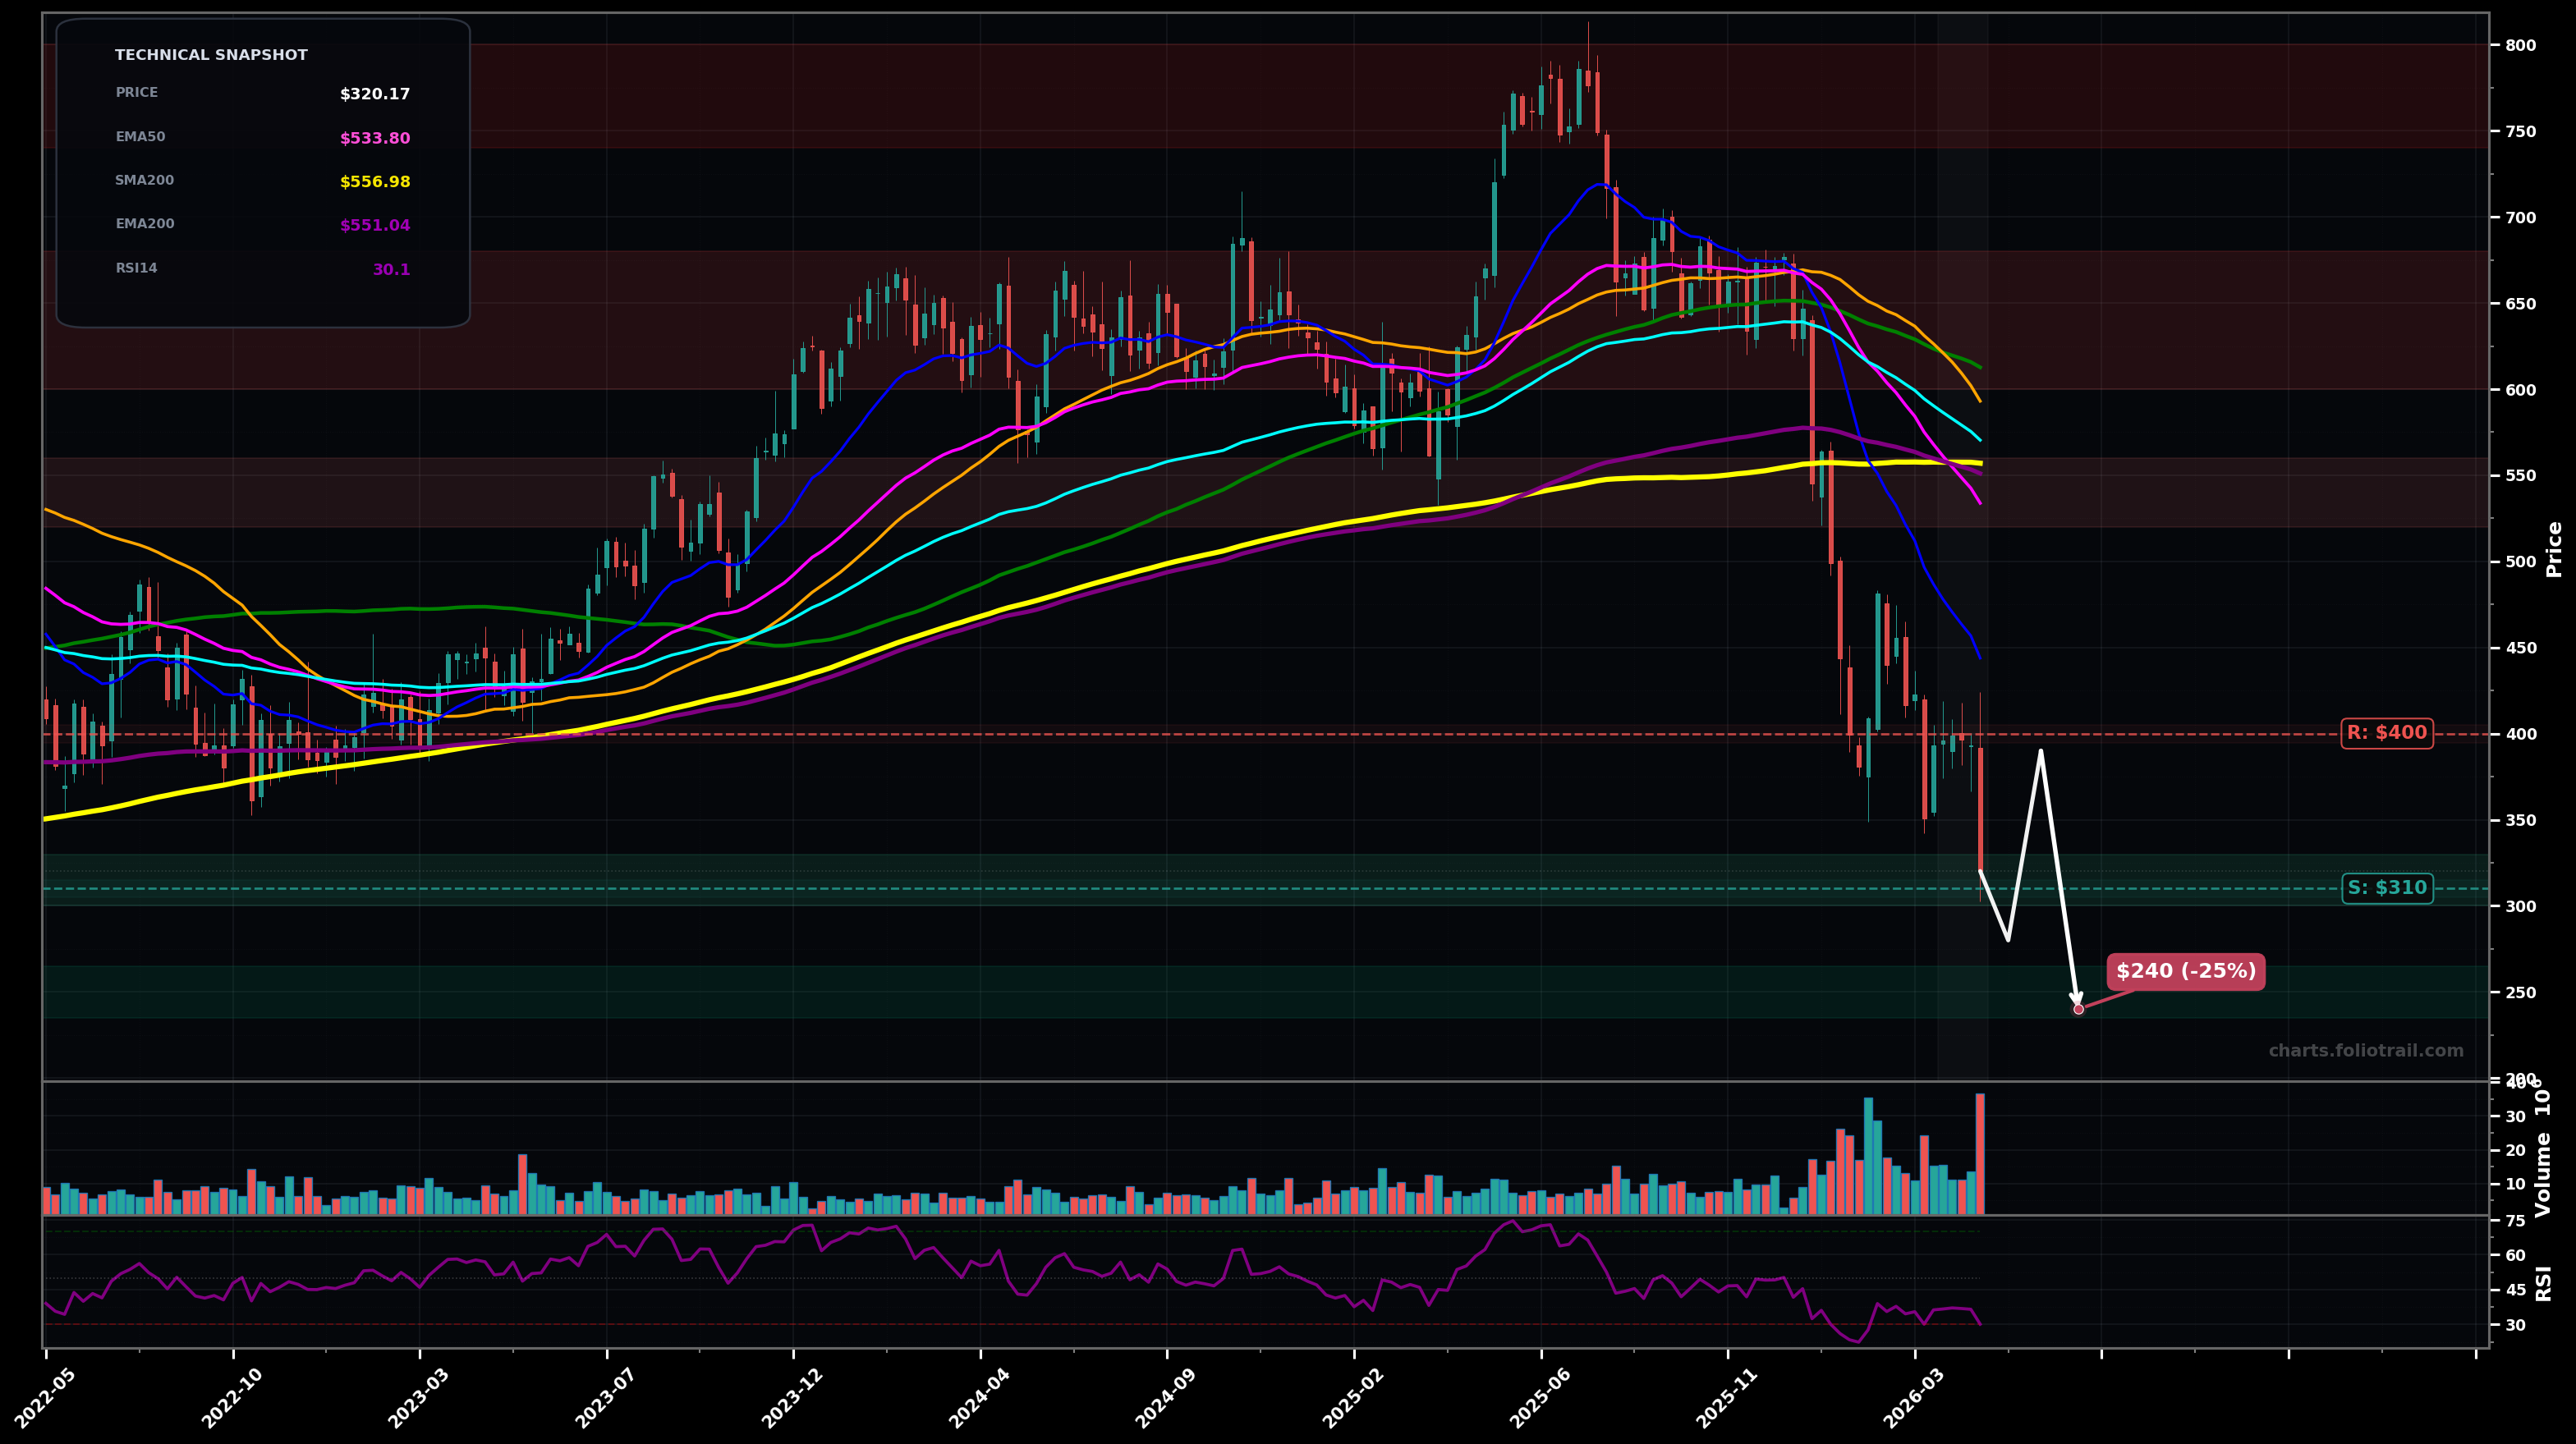
As of May 22, 2026, INTU (Intuit Inc.) is in a falling knife state on the weekly chart, with a confidence level of 82%. Key support is at $310 and key resistance at $400. Sharp selloff from ~$680 area broke multiple MA supports; price now ~$320 with RSI(14) ~30 (oversold) and heavy volume, trend structure remains LH/LL.
Dead-cat bounce from the $310-$320 area, then rejection near broken support/fast MAs; price likely retests the lows before any durable base forms (prob ~60%).
Oversold capitulation marks a swing low; price consolidates and reclaims $400, then mean-reverts toward the next resistance cluster (prob ~40%).
Weekly close below $310 confirms continued falling-knife continuation risk
Weekly close back above $400 would be the first meaningful reclaim/structure shift attempt
Staggered buys around current swing-low support (~$310) with adds on breakdown to next demand levels; heavy add aligns with deeper capitulation/likely Fib extension zone after a failed bounce.
Trim into mean-reversion back to major MA clusters (EMA200/SMA200 ~$551-$557) and prior breakdown supply ($600-$680); full close near prior cycle highs (~$780) where long-term stretch/exhaustion risk rises.
As of May 22, 2026, INTU (Intuit Inc.) is in a falling knife state on the weekly chart with 82% confidence. Sharp selloff from ~$680 area broke multiple MA supports; price now ~$320 with RSI(14) ~30 (oversold) and heavy volume, trend structure remains LH/LL.
On the weekly timeframe, INTU has key support at $310 and key resistance at $400. The most likely scenario (bearish) targets $280 and $240, with a revert level at $390.
INTU (Intuit Inc.) is currently classified as falling knife on the weekly chart, with 82% confidence. Confirmation requires: Weekly close below $310 confirms continued falling-knife continuation risk This would be invalidated by: Weekly close back above $400 would be the first meaningful reclaim/structure shift attempt
The most likely scenario (bearish) targets $280 and $240, with a revert level at $390. The alternative scenario (bullish) targets $440 and $500.
Multi-layer AI agents analyse 200+ stocks across daily, weekly, and monthly timeframes — producing market state classifications, price scenarios with targets, and position entry/exit levels. Daily charts updated every trading day at 6 PM ET. Weekly charts refresh Fridays. Monthly charts refresh on the last trading day of each month. No paywall. No sign-up required.
Built by Foliotrail.
All content on this website — including charts, analysis, price targets, support/resistance levels, and position zones — is generated entirely by AI and provided for educational and informational purposes only.
This is not financial advice. NEXUSNOIR VENTURES SL (the operator of this website) is not a registered investment adviser or broker-dealer. You should not make investment decisions based solely on this information. Always do your own research and consult a qualified financial advisor.
By continuing, you acknowledge that you have read and agree to our full disclaimer & terms of use and privacy policy.