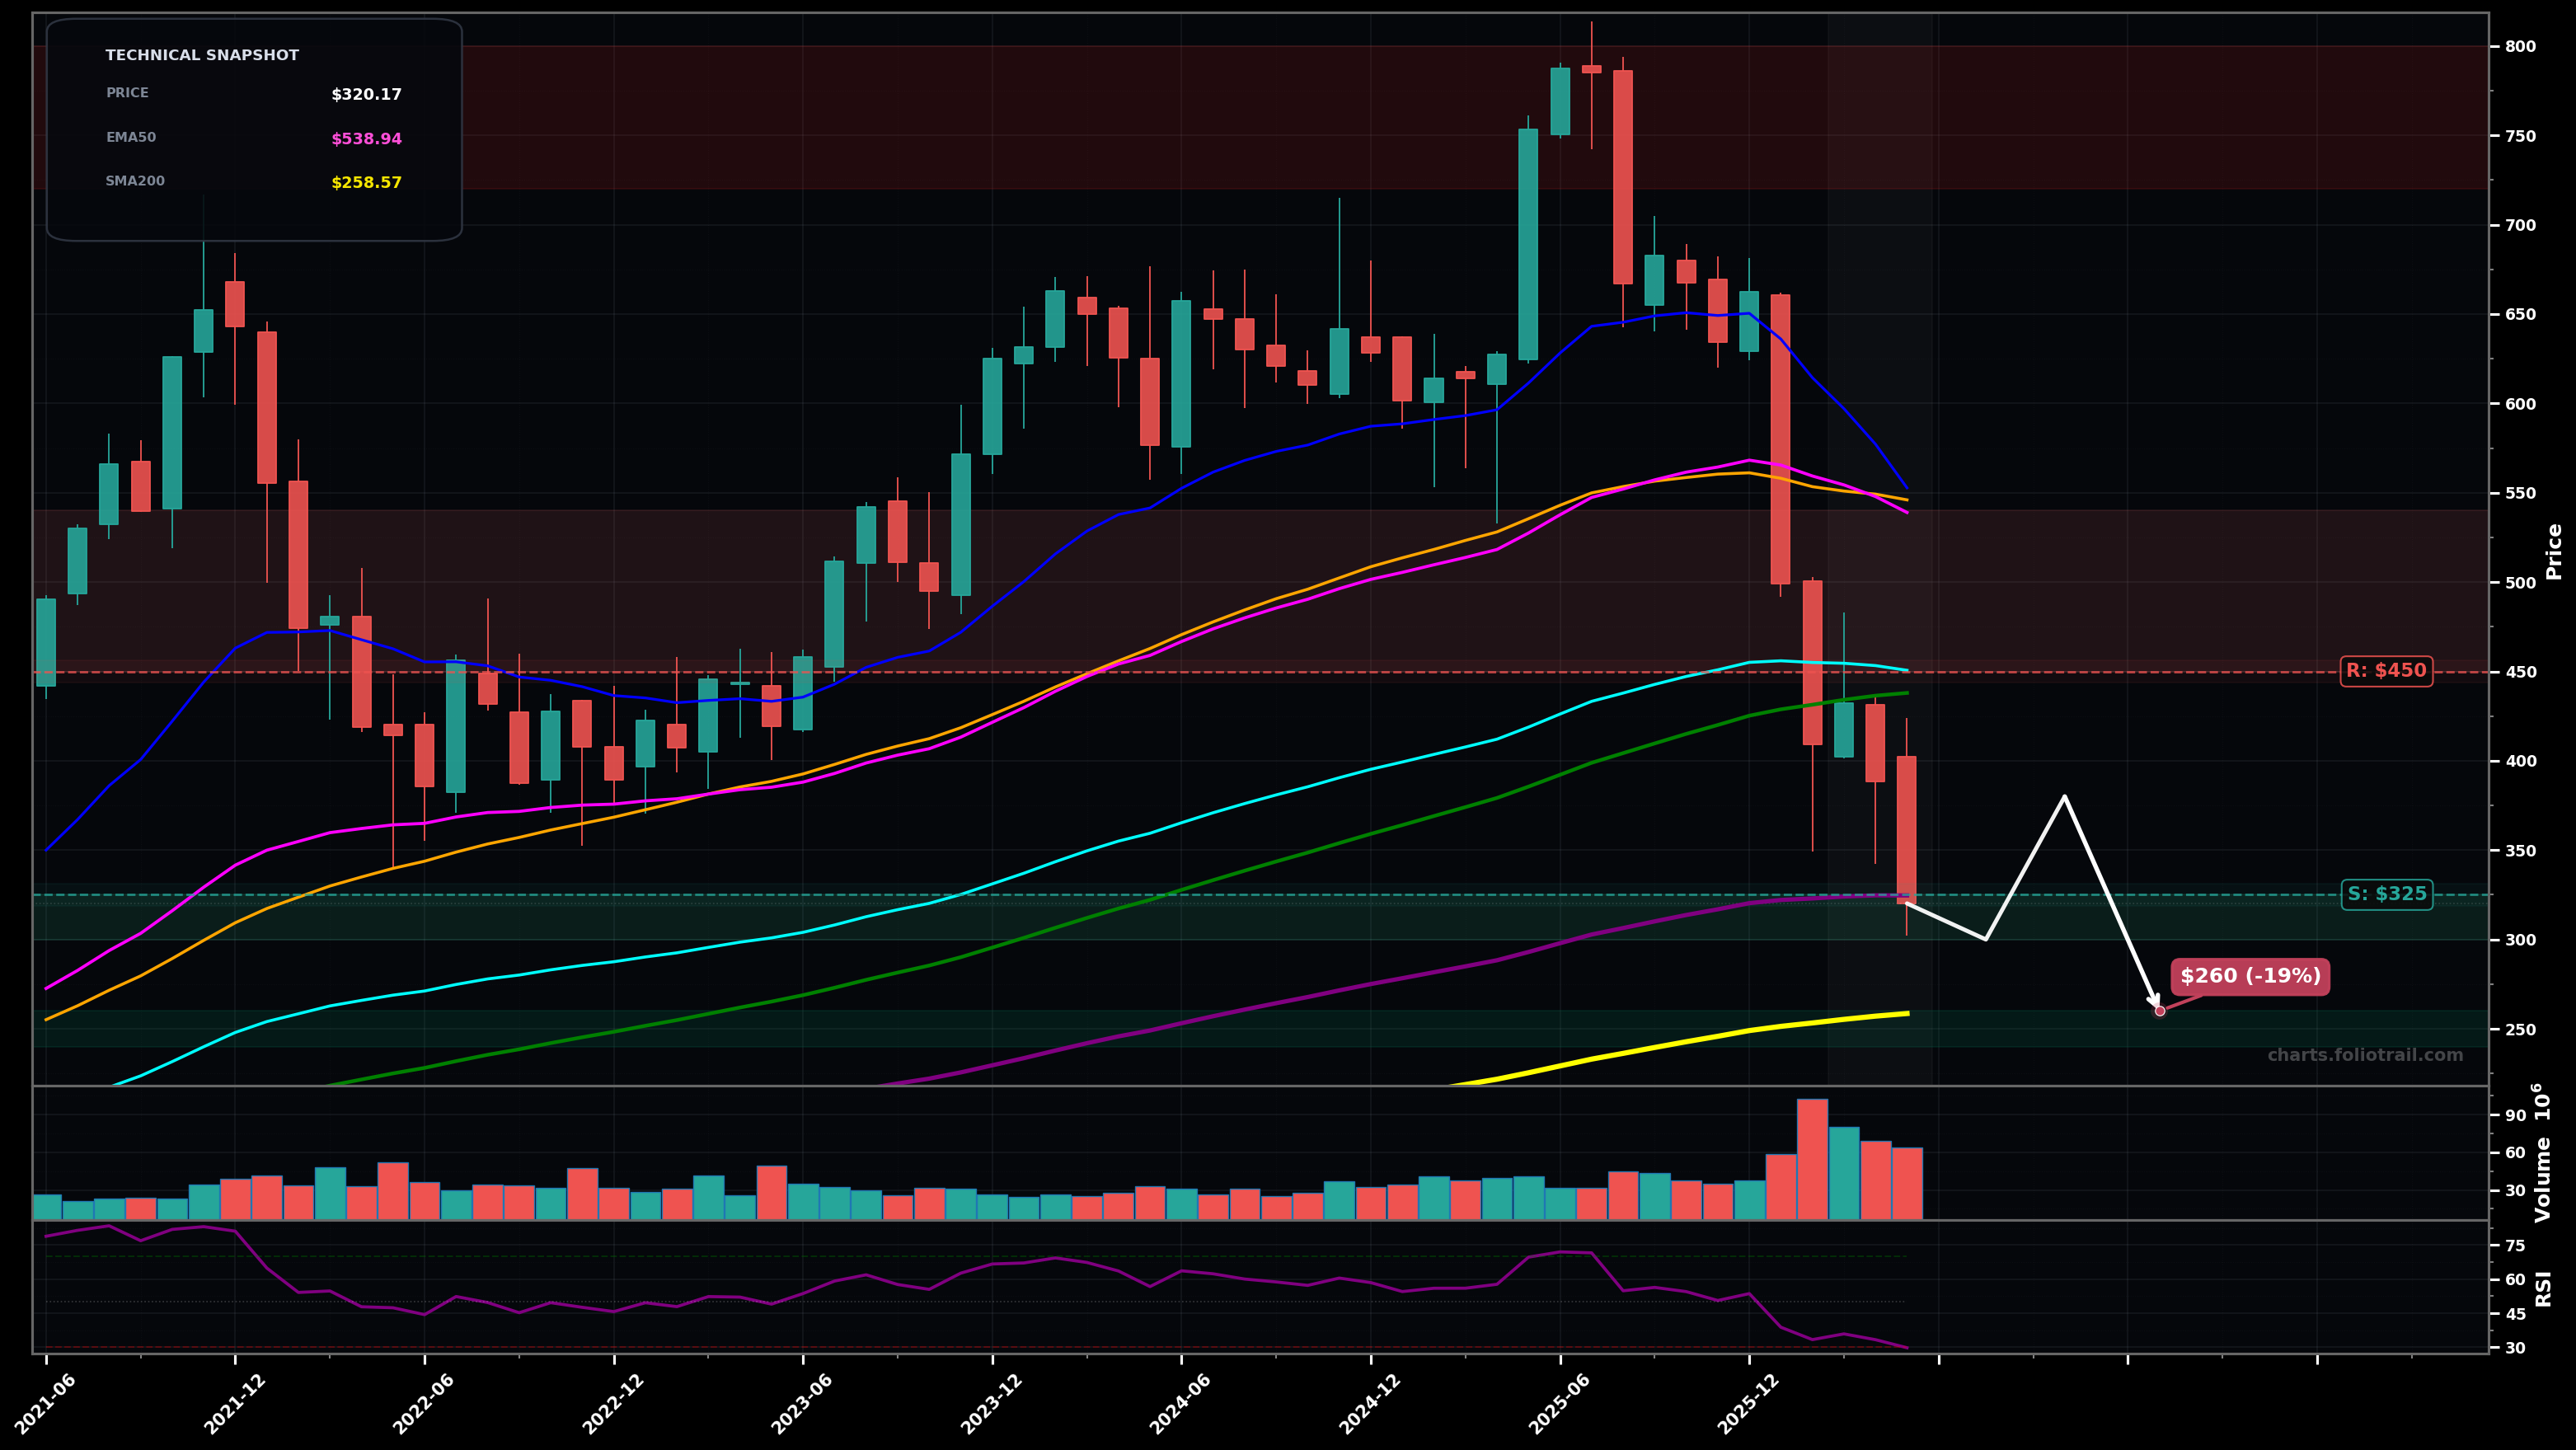
As of May 22, 2026, INTU (Intuit Inc.) is in a falling knife state on the monthly chart, with a confidence level of 78%. Key support is at $325 and key resistance at $450. Monthly selloff with multiple large red closes; price at ~$320.17 has broken down below EMA50/EMA100 and lost prior support with rising volume; RSI-14 ~29.8 (oversold).
Bearish continuation: weak bounce/oversold relief is sold into, then price retests/breaks the ~$325 swing-area and probes the next major demand near the long-term SMA200 zone.
Bottoming attempt: capitulation holds above ~$310-$325, forming a higher low on the monthly; then a squeeze back toward the EMA200/EMA100 area before sellers reappear.
Monthly close below $310 would confirm continued FALLING_KNIFE pressure (next leg down likely).
Two consecutive monthly closes back above $450 would invalidate FALLING_KNIFE and shift toward a bottoming/reversal thesis.
Entries staged around current swing-support (~$325) and likely Fibonacci/mean-reversion magnet at SMA200 (~$258) with heavy add only on deeper capitulation/flush below support.
Trim into reclaimed major MAs (EMA100/EMA50 zone) and prior breakdown supply; fully exit into former blow-off/ATH supply (~$720-$800) consistent with late-cycle Elliott Wave extension risk.
As of May 22, 2026, INTU (Intuit Inc.) is in a falling knife state on the monthly chart with 78% confidence. Monthly selloff with multiple large red closes; price at ~$320.17 has broken down below EMA50/EMA100 and lost prior support with rising volume; RSI-14 ~29.8 (oversold).
On the monthly timeframe, INTU has key support at $325 and key resistance at $450. The most likely scenario (bearish) targets $300 and $260, with a revert level at $380.
INTU (Intuit Inc.) is currently classified as falling knife on the monthly chart, with 78% confidence. Confirmation requires: Monthly close below $310 would confirm continued FALLING_KNIFE pressure (next leg down likely). This would be invalidated by: Two consecutive monthly closes back above $450 would invalidate FALLING_KNIFE and shift toward a bottoming/reversal thesis.
The most likely scenario (bearish) targets $300 and $260, with a revert level at $380. The alternative scenario (bullish) targets $380 and $450.
Multi-layer AI agents analyse 200+ stocks across daily, weekly, and monthly timeframes — producing market state classifications, price scenarios with targets, and position entry/exit levels. Daily charts updated every trading day at 6 PM ET. Weekly charts refresh Fridays. Monthly charts refresh on the last trading day of each month. No paywall. No sign-up required.
Built by Foliotrail.
All content on this website — including charts, analysis, price targets, support/resistance levels, and position zones — is generated entirely by AI and provided for educational and informational purposes only.
This is not financial advice. NEXUSNOIR VENTURES SL (the operator of this website) is not a registered investment adviser or broker-dealer. You should not make investment decisions based solely on this information. Always do your own research and consult a qualified financial advisor.
By continuing, you acknowledge that you have read and agree to our full disclaimer & terms of use and privacy policy.