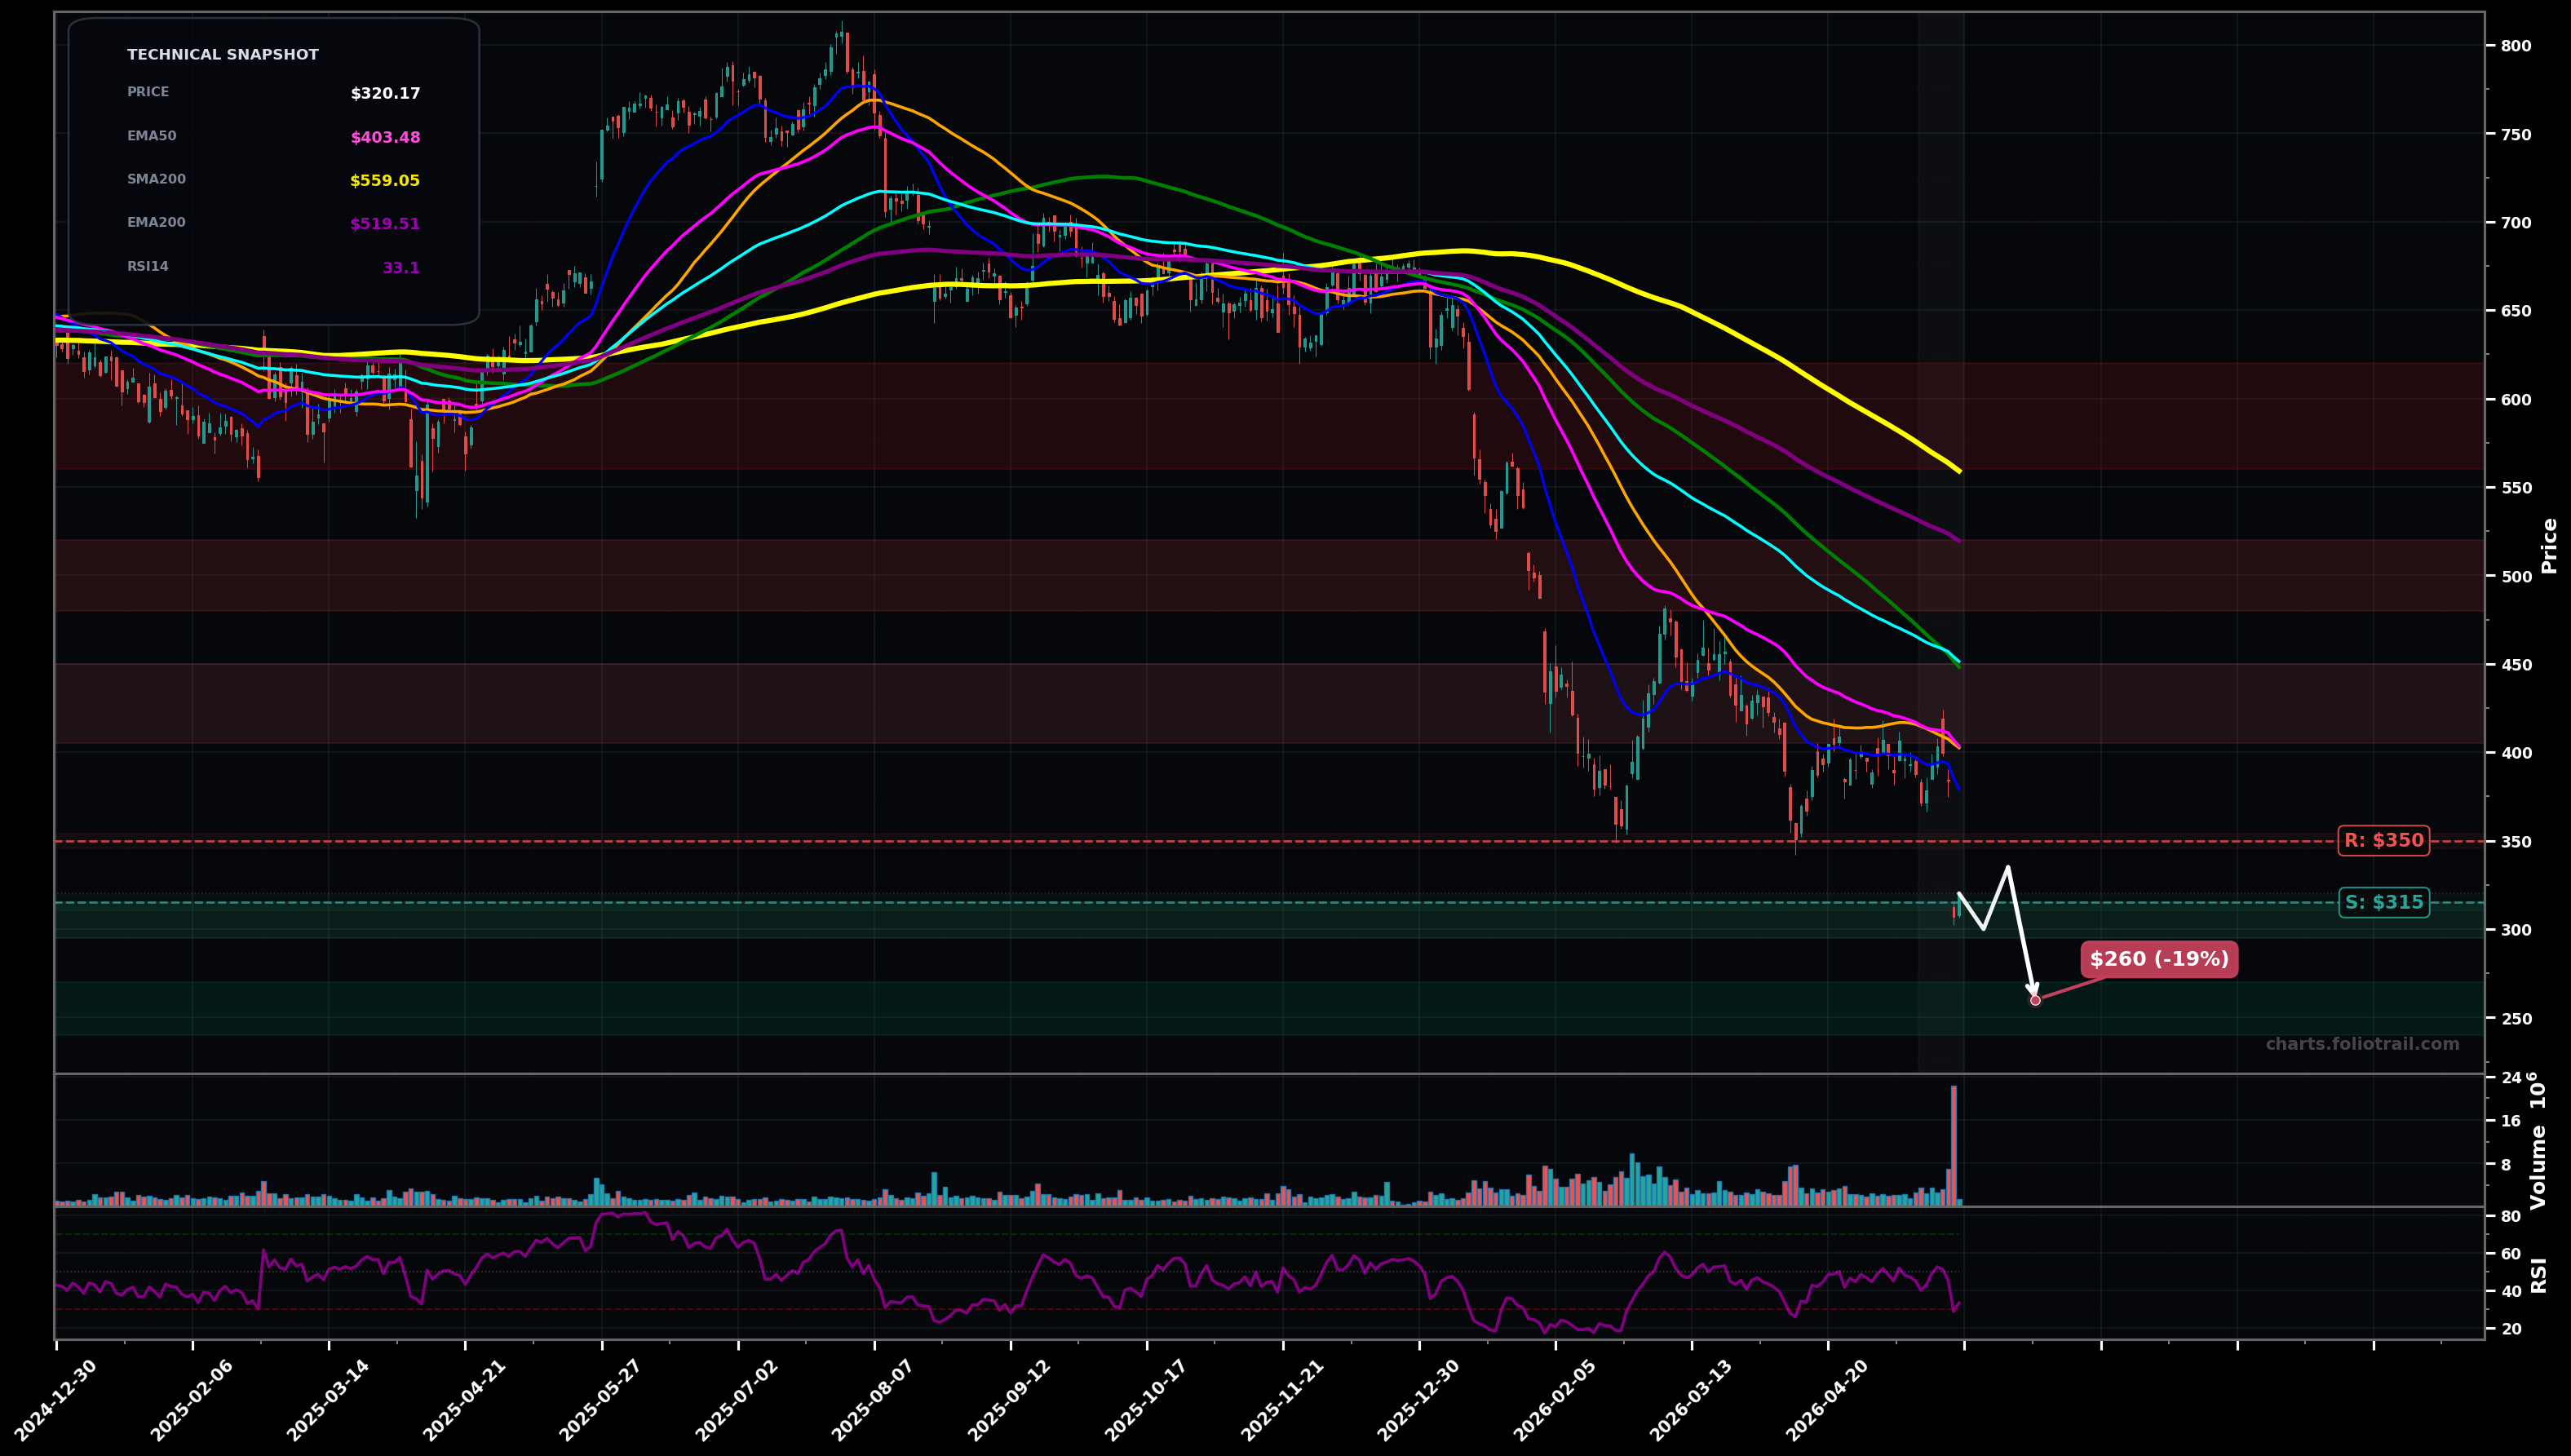
As of May 22, 2026, INTU (Intuit Inc.) is in a falling knife state on the daily chart, with a confidence level of 74%. Key support is at $315 and key resistance at $350. Price at $320.17 is breaking down to fresh lows on a big volume spike; still well below declining EMA50/EMA100 with RSI ~33 (weak momentum).
Bearish continuation: price retests/breaks the recent low zone, then attempts a weak bounce into declining short MAs (dead-cat bounce). Rough probability 60%.
Capitulation low + bounce: spike-volume washout holds, then mean-reversion rally toward EMA20/EMA50 area; needs follow-through to become a true bottoming attempt. Rough probability 40%.
Daily close below $315 would confirm continuation of the falling-knife leg.
Two daily closes back above $355 would invalidate falling-knife risk and shift toward a bottoming attempt.
Entries staged around the current pivot-low/support shelf ($315) and Fibonacci-style deeper retracement zones if the impulse down extends; avoid sizing heavily until a HL or reclaim of EMA50 occurs.
Trim into mean-reversion rallies back to clustered MAs (EMA50/SMA50 region) and larger downtrend MAs (EMA100/EMA200/SMA200) where prior breakdown supply likely sits.
As of May 22, 2026, INTU (Intuit Inc.) is in a falling knife state on the daily chart with 74% confidence. Price at $320.17 is breaking down to fresh lows on a big volume spike; still well below declining EMA50/EMA100 with RSI ~33 (weak momentum).
On the daily timeframe, INTU has key support at $315 and key resistance at $350. The most likely scenario (bearish) targets $300 and $260, with a revert level at $335.
INTU (Intuit Inc.) is currently classified as falling knife on the daily chart, with 74% confidence. Confirmation requires: Daily close below $315 would confirm continuation of the falling-knife leg. This would be invalidated by: Two daily closes back above $355 would invalidate falling-knife risk and shift toward a bottoming attempt.
The most likely scenario (bearish) targets $300 and $260, with a revert level at $335. The alternative scenario (bullish) targets $355 and $405.
Multi-layer AI agents analyse 200+ stocks across daily, weekly, and monthly timeframes — producing market state classifications, price scenarios with targets, and position entry/exit levels. Daily charts updated every trading day at 6 PM ET. Weekly charts refresh Fridays. Monthly charts refresh on the last trading day of each month. No paywall. No sign-up required.
Built by Foliotrail.
All content on this website — including charts, analysis, price targets, support/resistance levels, and position zones — is generated entirely by AI and provided for educational and informational purposes only.
This is not financial advice. NEXUSNOIR VENTURES SL (the operator of this website) is not a registered investment adviser or broker-dealer. You should not make investment decisions based solely on this information. Always do your own research and consult a qualified financial advisor.
By continuing, you acknowledge that you have read and agree to our full disclaimer & terms of use and privacy policy.