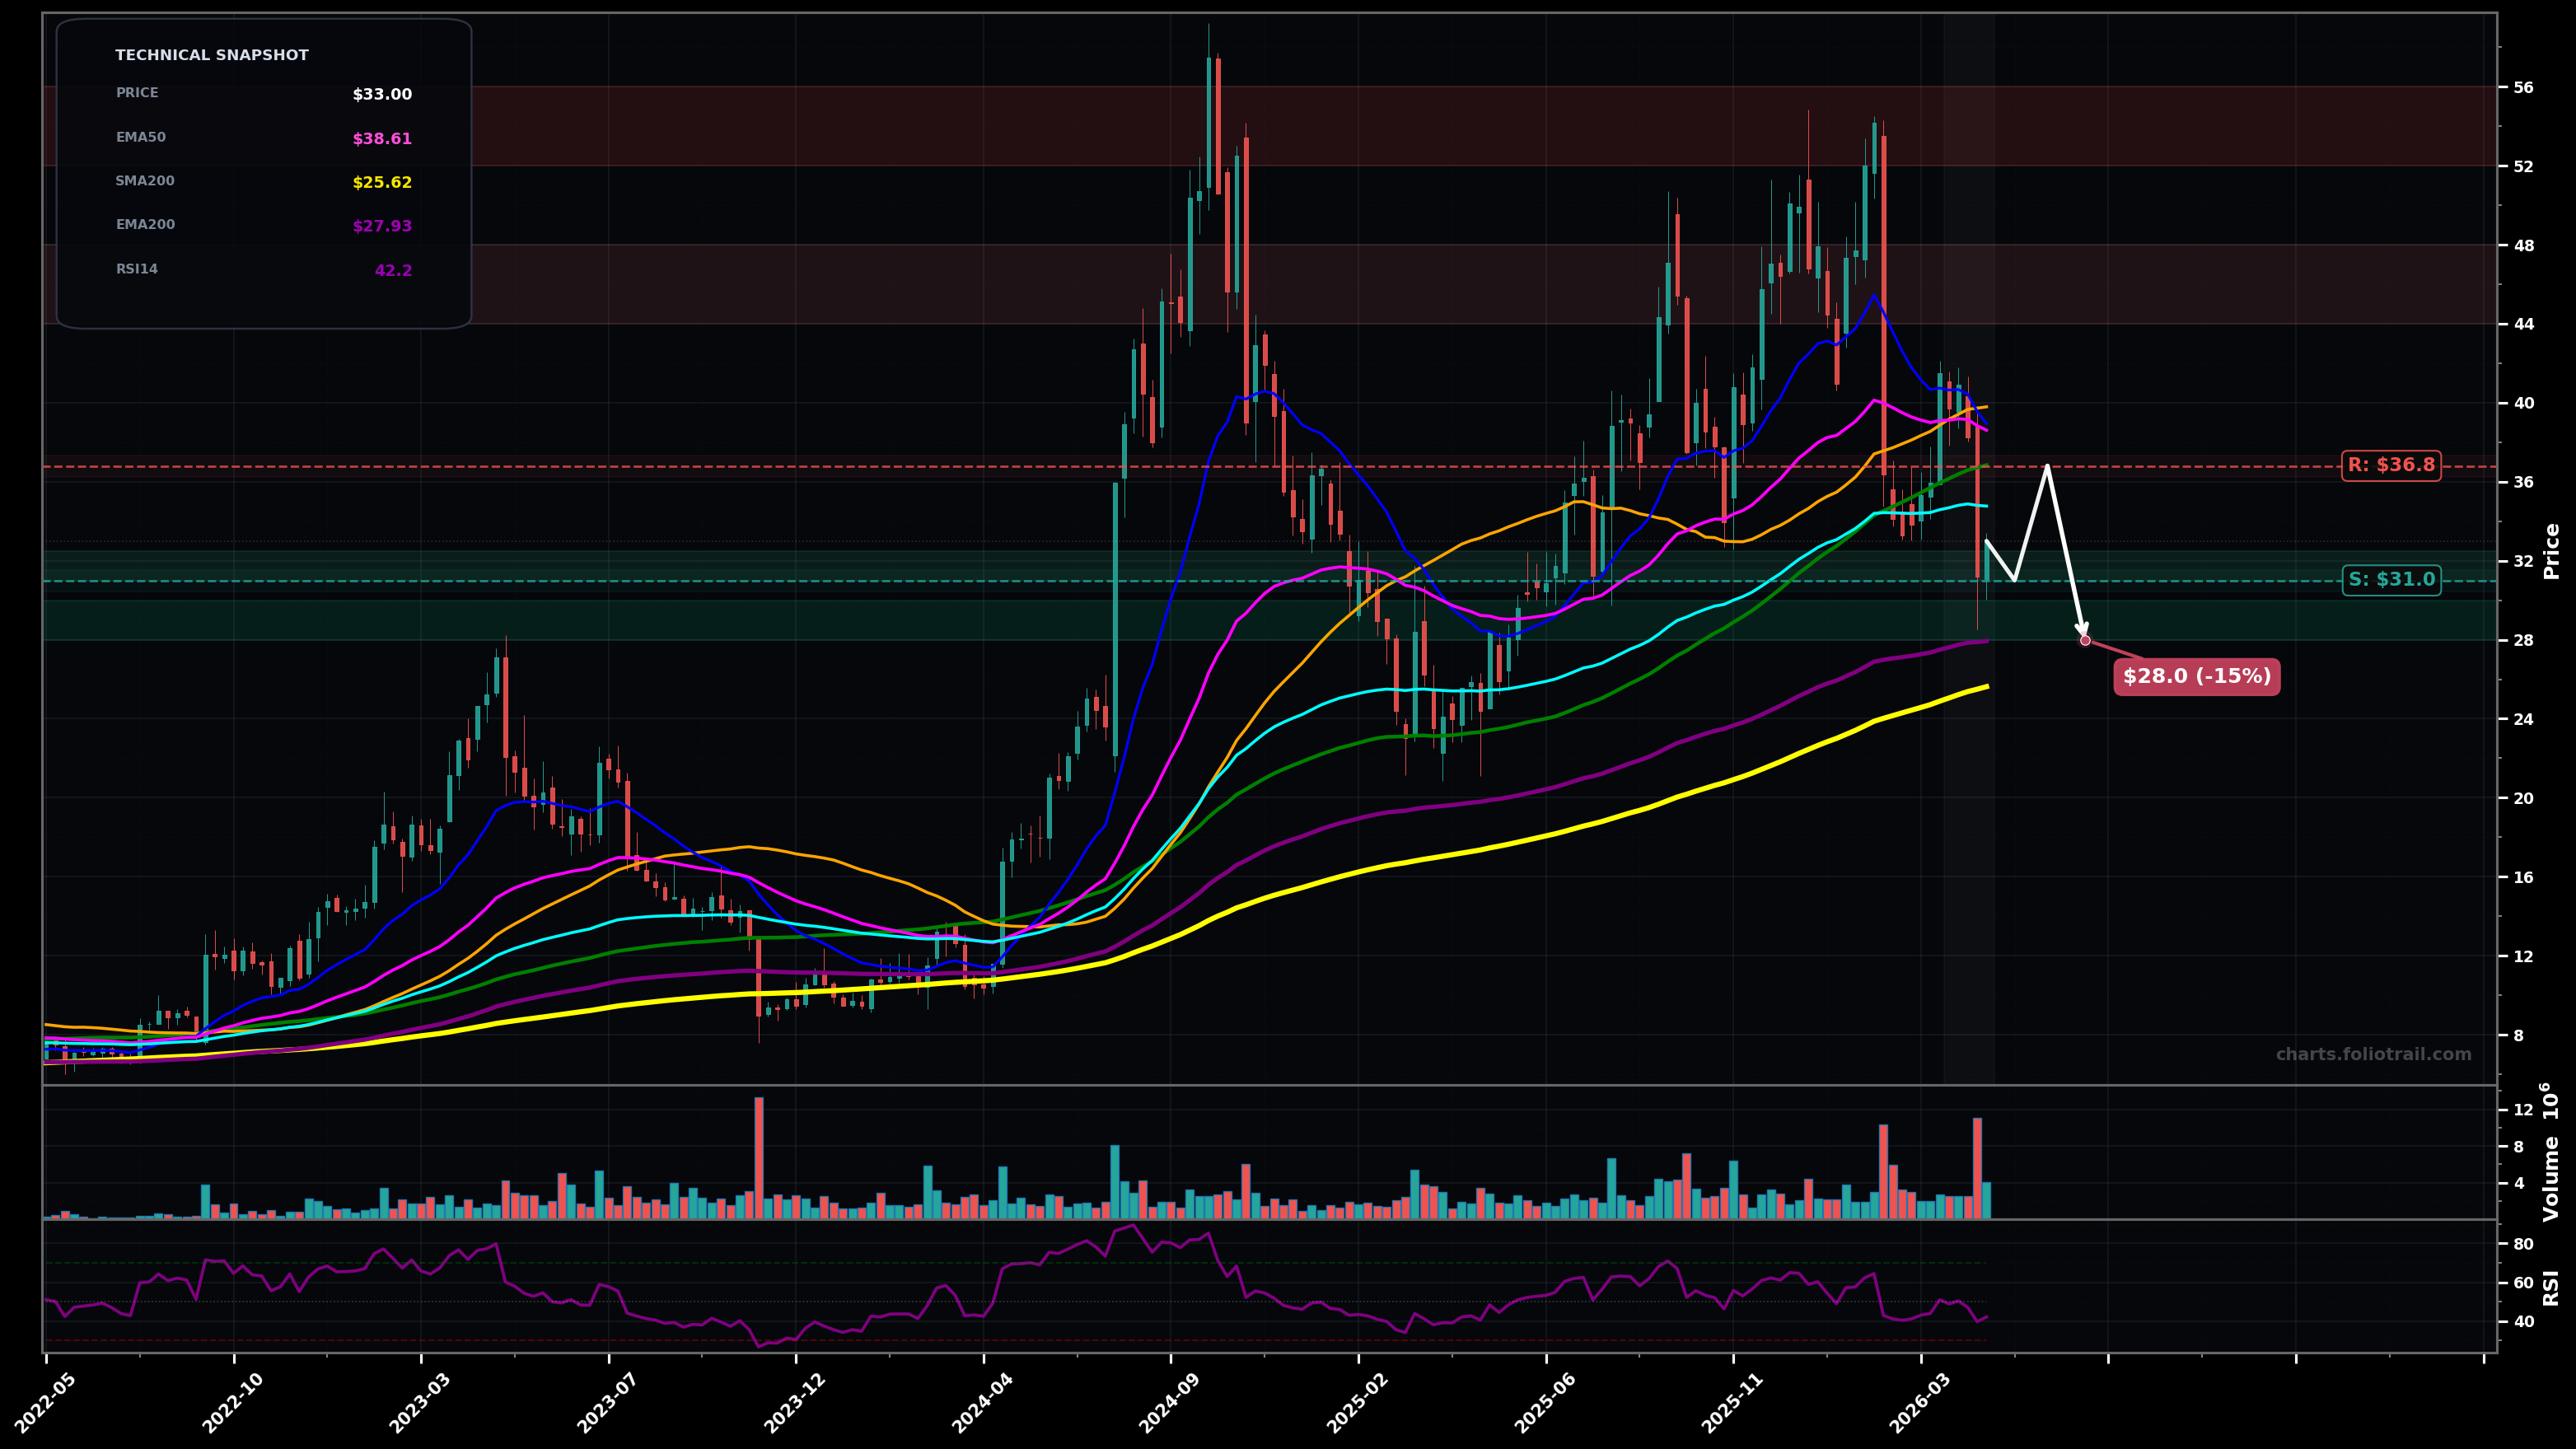
As of May 22, 2026, HROW (Harrow Inc.) is in a downtrend state on the weekly chart, with a confidence level of 72%. Key support is at $31.0 and key resistance at $36.8. Weekly trend broke down from the $40-$42 area; sharp selloff to ~$31-$33 with a small bounce, price now below EMA50/EMA100 and below SMA50/SMA100.
Bear-flag / dead-cat-bounce into the $35-$37 MA cluster, then rejection and a retest of $31 support; if $31 fails, continuation toward the high-$20s (near EMA200). Prob ~60%.
Bottoming attempt: holds $31, forms a higher low, then reclaims EMA100 ($34.76) and pushes toward the bigger confluence at $39-$40 (SMA50/EMA50). Prob ~40%.
Weekly close below $31.00 (break of the recent swing-low zone) would confirm continued downtrend pressure
2+ weekly closes back above $38.60 (EMA50) would invalidate the current downtrend bias and shift toward a breakout-reversal setup
Stage bids at the $31 swing-low support; add on a flush toward EMA200 (~$27.9) / prior base; heavy add only near SMA200 (~$25.6) where long-term trend support typically sits.
Trim into prior supply zones and extension moves: first near mid-$40s (prior pivots), more into the $52-$56 prior highs, and fully exit on a euphoric extension above prior peak area.
As of May 22, 2026, HROW (Harrow Inc.) is in a downtrend state on the weekly chart with 72% confidence. Weekly trend broke down from the $40-$42 area; sharp selloff to ~$31-$33 with a small bounce, price now below EMA50/EMA100 and below SMA50/SMA100.
On the weekly timeframe, HROW has key support at $31.0 and key resistance at $36.8. The most likely scenario (bearish) targets $31.0 and $28.0, with a revert level at $36.8.
HROW (Harrow Inc.) is currently classified as downtrend on the weekly chart, with 72% confidence. Confirmation requires: Weekly close below $31.00 (break of the recent swing-low zone) would confirm continued downtrend pressure This would be invalidated by: 2+ weekly closes back above $38.60 (EMA50) would invalidate the current downtrend bias and shift toward a breakout-reversal setup
The most likely scenario (bearish) targets $31.0 and $28.0, with a revert level at $36.8. The alternative scenario (bullish) targets $34.8 and $39.8.
Multi-layer AI agents analyse 200+ stocks across daily, weekly, and monthly timeframes — producing market state classifications, price scenarios with targets, and position entry/exit levels. Daily charts updated every trading day at 6 PM ET. Weekly charts refresh Fridays. Monthly charts refresh on the last trading day of each month. No paywall. No sign-up required.
Built by Foliotrail.
All content on this website — including charts, analysis, price targets, support/resistance levels, and position zones — is generated entirely by AI and provided for educational and informational purposes only.
This is not financial advice. NEXUSNOIR VENTURES SL (the operator of this website) is not a registered investment adviser or broker-dealer. You should not make investment decisions based solely on this information. Always do your own research and consult a qualified financial advisor.
By continuing, you acknowledge that you have read and agree to our full disclaimer & terms of use and privacy policy.