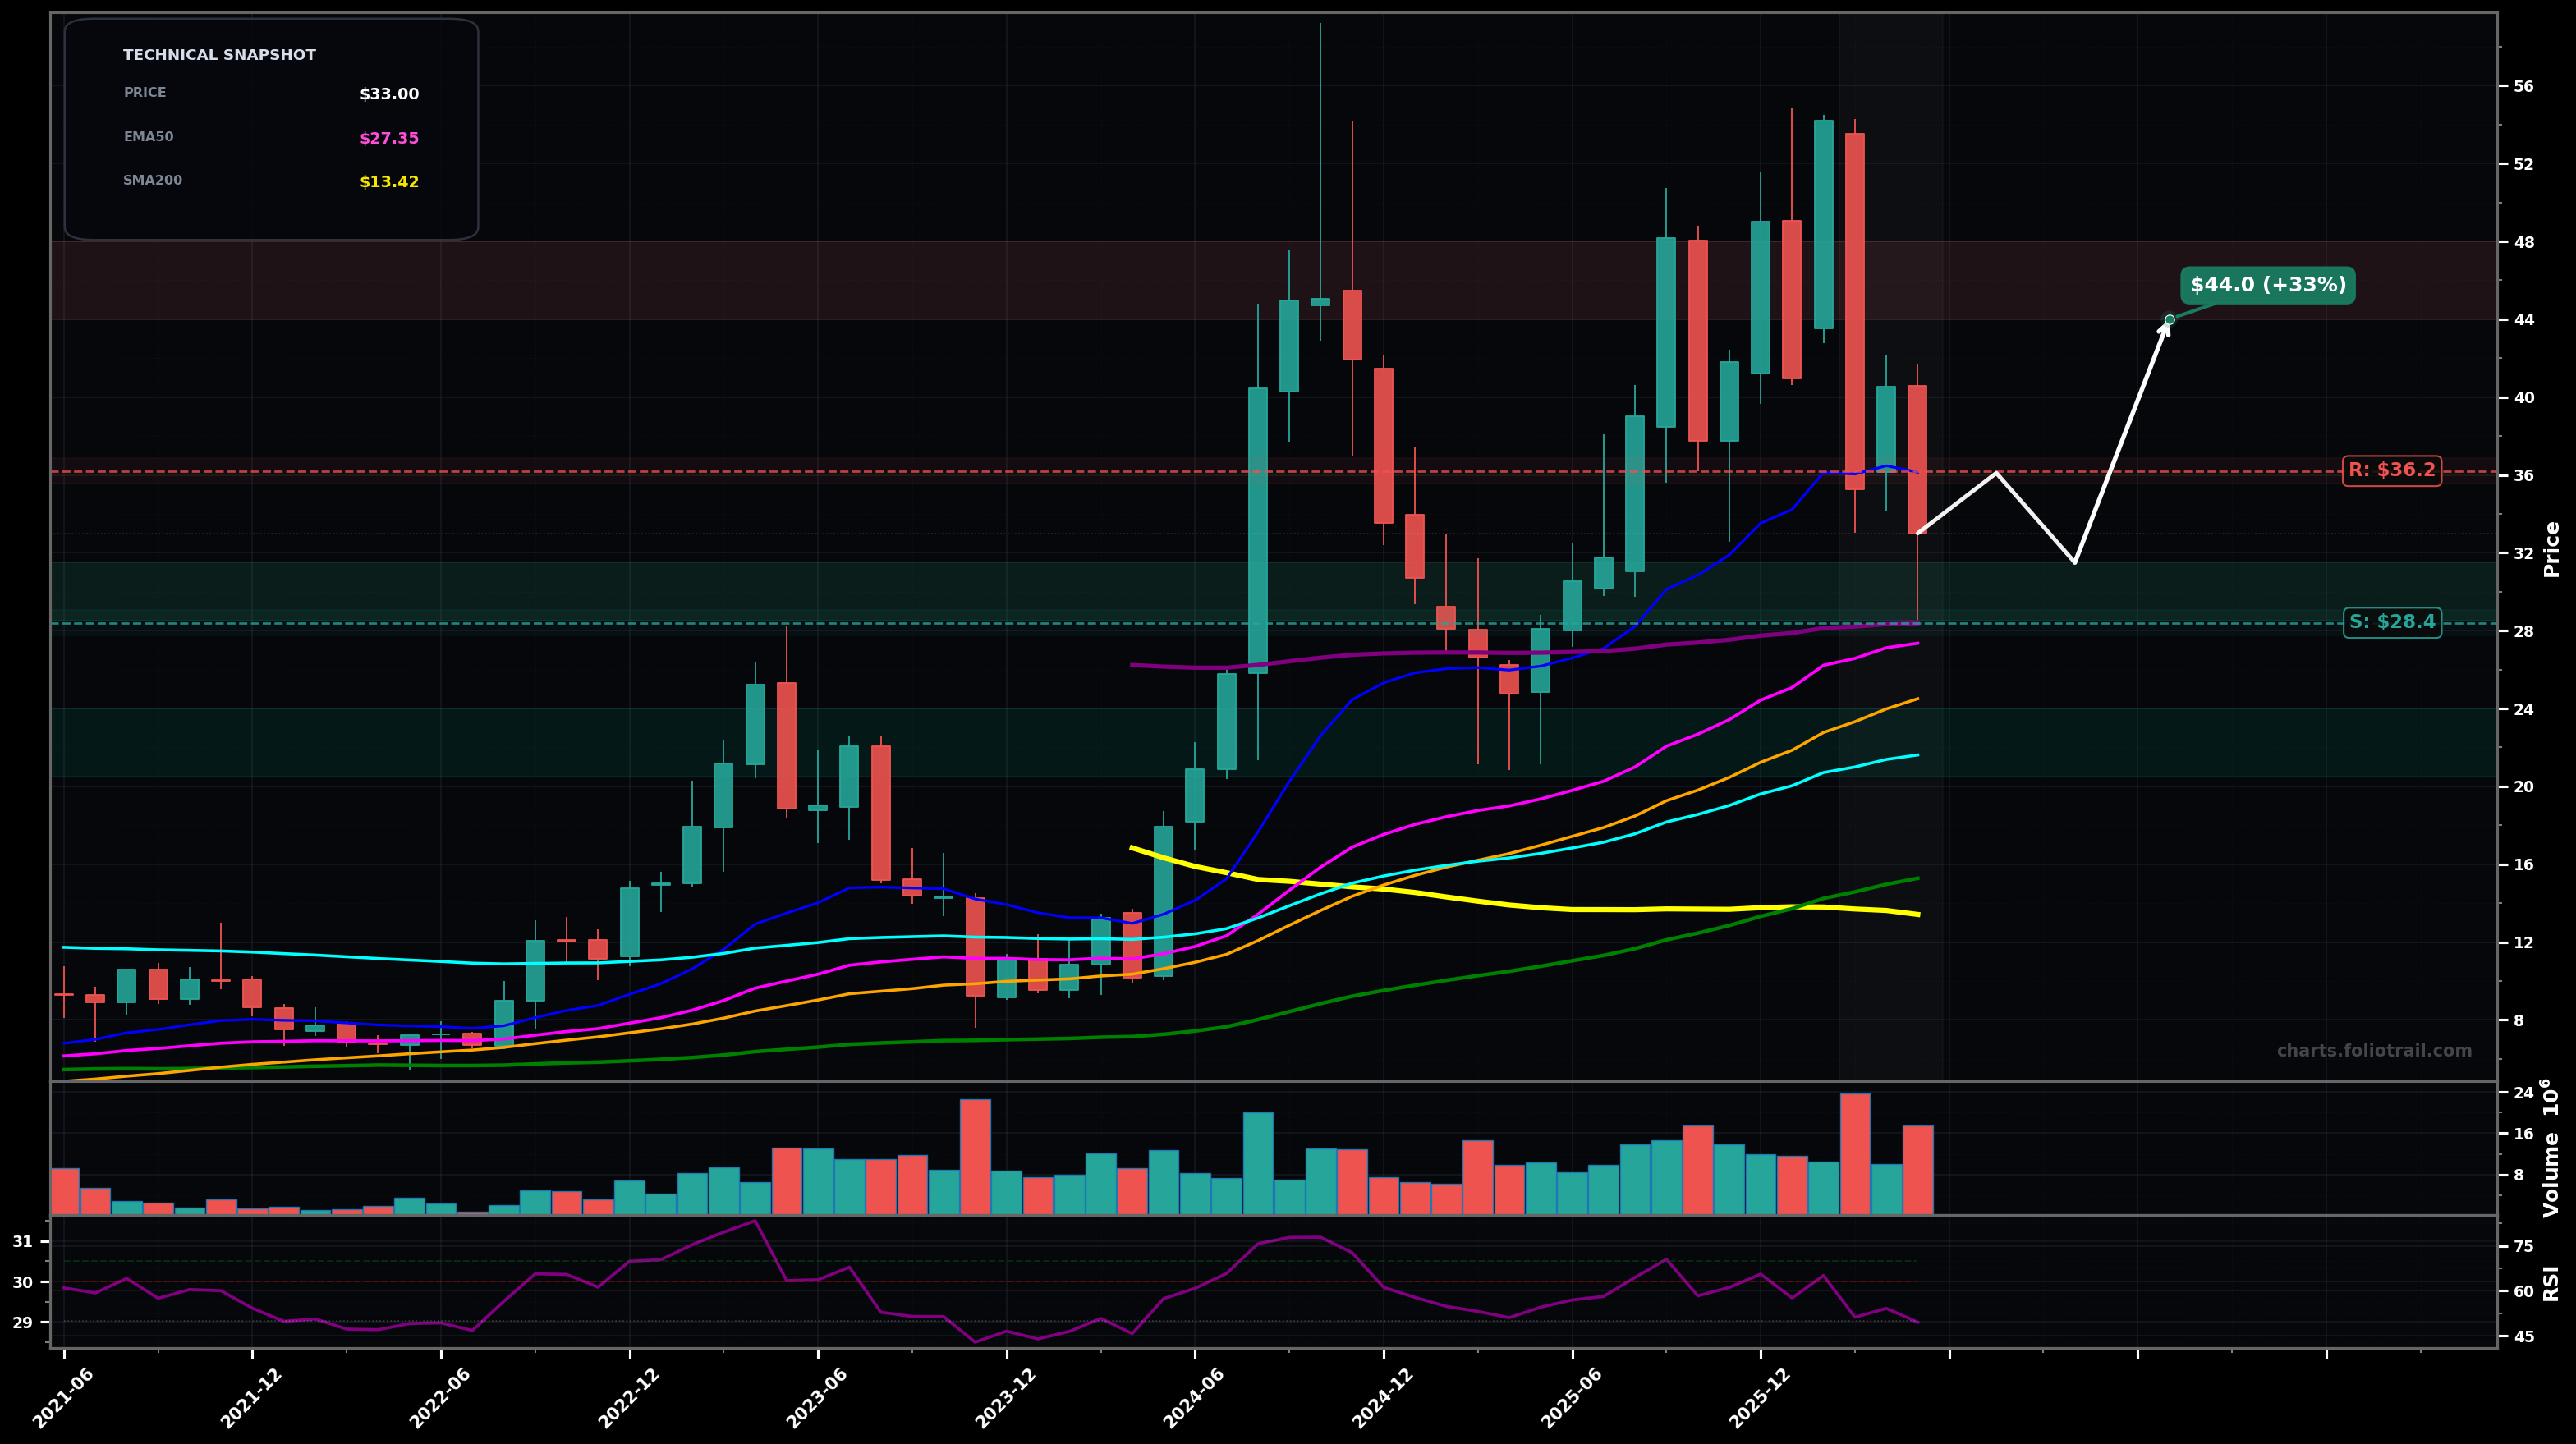
As of May 22, 2026, HROW (Harrow Inc.) is in a choppy range state on the monthly chart, with a confidence level of 62%. Key support is at $28.4 and key resistance at $36.2. Monthly pullback to ~$33 after failing near prior highs (~$54–$56); price still above EMA50/100/200 but below faster EMA20 (~$36) with RSI ~50 drifting down.
Base-building above the EMA200 (~$28) then reclaim EMA20 (~$36) to rotate back toward the mid/upper range; Elliott view: likely working through a Wave 4-style correction (sideways-to-down) before a Wave 5 attempt.
Support at the EMA200/pivot area (~$28) fails; momentum shifts to a deeper retracement of the 2024–2026 advance; Elliott view: the correction is not Wave 4 but a larger A-B-C that extends lower.
CHOPPY_RANGE confirmed if price holds between $28 and $40 for 2+ monthly closes (no breakout above $40 or breakdown below $28).
Invalidated if a monthly close > $40 (bull breakout) or < $28 (bear breakdown).
Start near EMA200/most recent swing-low support (~$28–$31); add on breakdown/retest or deeper Fib retrace toward SMA50/EMA100 zone (~$24–$28); heavy add only if capitulation pushes into the next higher-timeframe demand (~$20–$24).
Trim into prior supply and measured-move/Fib extension zones: first at mid-range resistance (~$44–$48), more at prior peak supply (~$52–$56), and close if a breakout becomes euphoric/extended above old highs into likely overextension (~$60+).
As of May 22, 2026, HROW (Harrow Inc.) is in a choppy range state on the monthly chart with 62% confidence. Monthly pullback to ~$33 after failing near prior highs (~$54–$56); price still above EMA50/100/200 but below faster EMA20 (~$36) with RSI ~50 drifting down.
On the monthly timeframe, HROW has key support at $28.4 and key resistance at $36.2. The most likely scenario (bullish) targets $36.1 and $44.0, with a revert level at $31.5.
HROW (Harrow Inc.) is currently classified as choppy range on the monthly chart, with 62% confidence. Confirmation requires: CHOPPY_RANGE confirmed if price holds between $28 and $40 for 2+ monthly closes (no breakout above $40 or breakdown below $28). This would be invalidated by: Invalidated if a monthly close > $40 (bull breakout) or < $28 (bear breakdown).
The most likely scenario (bullish) targets $36.1 and $44.0, with a revert level at $31.5. The alternative scenario (bearish) targets $28.0 and $24.5.
Multi-layer AI agents analyse 200+ stocks across daily, weekly, and monthly timeframes — producing market state classifications, price scenarios with targets, and position entry/exit levels. Daily charts updated every trading day at 6 PM ET. Weekly charts refresh Fridays. Monthly charts refresh on the last trading day of each month. No paywall. No sign-up required.
Built by Foliotrail.
All content on this website — including charts, analysis, price targets, support/resistance levels, and position zones — is generated entirely by AI and provided for educational and informational purposes only.
This is not financial advice. NEXUSNOIR VENTURES SL (the operator of this website) is not a registered investment adviser or broker-dealer. You should not make investment decisions based solely on this information. Always do your own research and consult a qualified financial advisor.
By continuing, you acknowledge that you have read and agree to our full disclaimer & terms of use and privacy policy.