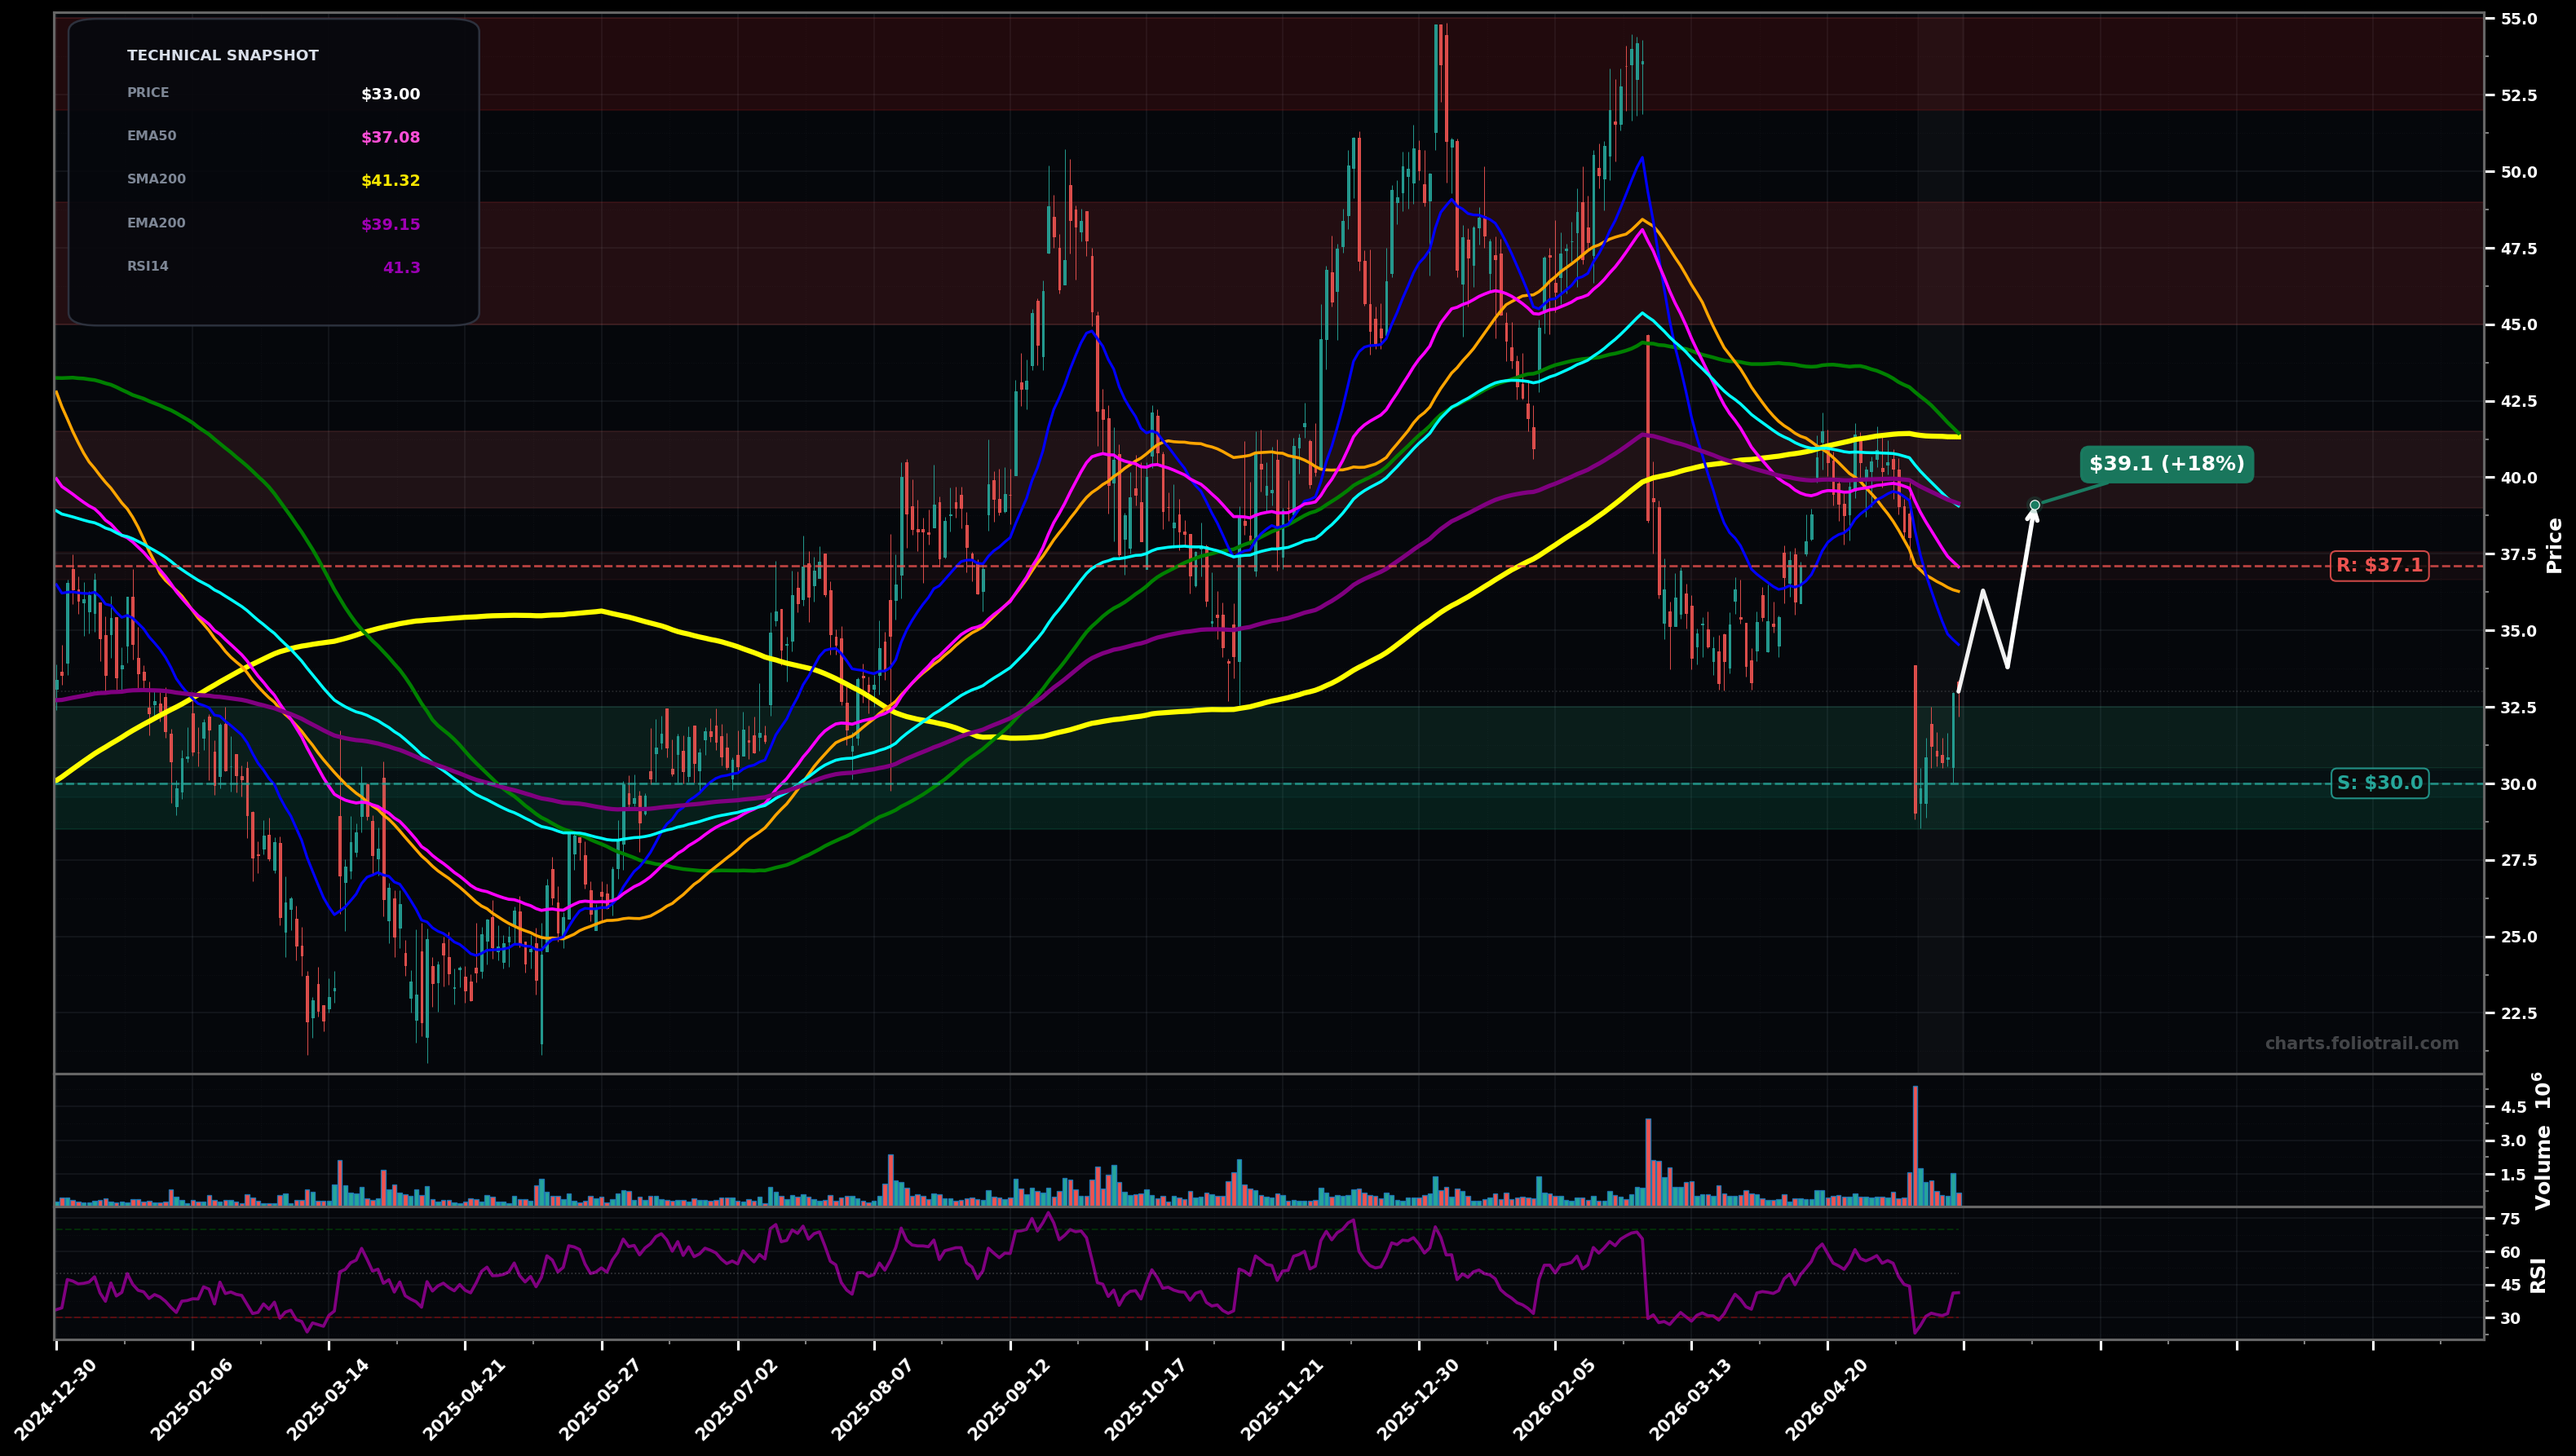
As of May 22, 2026, HROW (Harrow Inc.) is in a bottoming attempt state on the daily chart, with a confidence level of 62%. Key support is at $30.0 and key resistance at $37.1. Price at $33.00 after a sharp selloff to the low-$30s; attempted rebound but still below all key MAs (EMA50/100/200 and SMA50/100/200).
Mean-reversion rally from the $30-$33 base back into the heavy MA-supply zone; expect chop/pauses near the falling EMA50/SMA50 cluster before deciding next leg (typical post-impulse down Wave (B) / corrective bounce).
Failure of the rebound and continuation lower: a retest of $30 support breaks, triggering another sell leg toward the prior demand pocket in the high-$20s (impulsive Wave (C) / Wave 5 extension risk).
Daily closes reclaim and hold above $37.10 (EMA50) for 2+ sessions.
Daily close below $30.00 (break of the most recent rebound base).
Stagger entries around the current swing-low base ($30-$33) and only add aggressively if a flush into prior support ($28 then $27 area) occurs; major overhead MA cluster sits $36-$41 so upside is likely capped until reclaimed.
Trim into the first big MA supply band (EMA100/200 ~ $39-$40 and SMA100/200 ~ $41) and then into prior distribution highs ($45-$55) where prior sellers previously overwhelmed demand.
As of May 22, 2026, HROW (Harrow Inc.) is in a bottoming attempt state on the daily chart with 62% confidence. Price at $33.00 after a sharp selloff to the low-$30s; attempted rebound but still below all key MAs (EMA50/100/200 and SMA50/100/200).
On the daily timeframe, HROW has key support at $30.0 and key resistance at $37.1. The most likely scenario (bullish) targets $36.3 and $39.1, with a revert level at $33.8.
HROW (Harrow Inc.) is currently classified as bottoming attempt on the daily chart, with 62% confidence. Confirmation requires: Daily closes reclaim and hold above $37.10 (EMA50) for 2+ sessions. This would be invalidated by: Daily close below $30.00 (break of the most recent rebound base).
The most likely scenario (bullish) targets $36.3 and $39.1, with a revert level at $33.8. The alternative scenario (bearish) targets $30.0 and $27.5.
Multi-layer AI agents analyse 200+ stocks across daily, weekly, and monthly timeframes — producing market state classifications, price scenarios with targets, and position entry/exit levels. Daily charts updated every trading day at 6 PM ET. Weekly charts refresh Fridays. Monthly charts refresh on the last trading day of each month. No paywall. No sign-up required.
Built by Foliotrail.
All content on this website — including charts, analysis, price targets, support/resistance levels, and position zones — is generated entirely by AI and provided for educational and informational purposes only.
This is not financial advice. NEXUSNOIR VENTURES SL (the operator of this website) is not a registered investment adviser or broker-dealer. You should not make investment decisions based solely on this information. Always do your own research and consult a qualified financial advisor.
By continuing, you acknowledge that you have read and agree to our full disclaimer & terms of use and privacy policy.