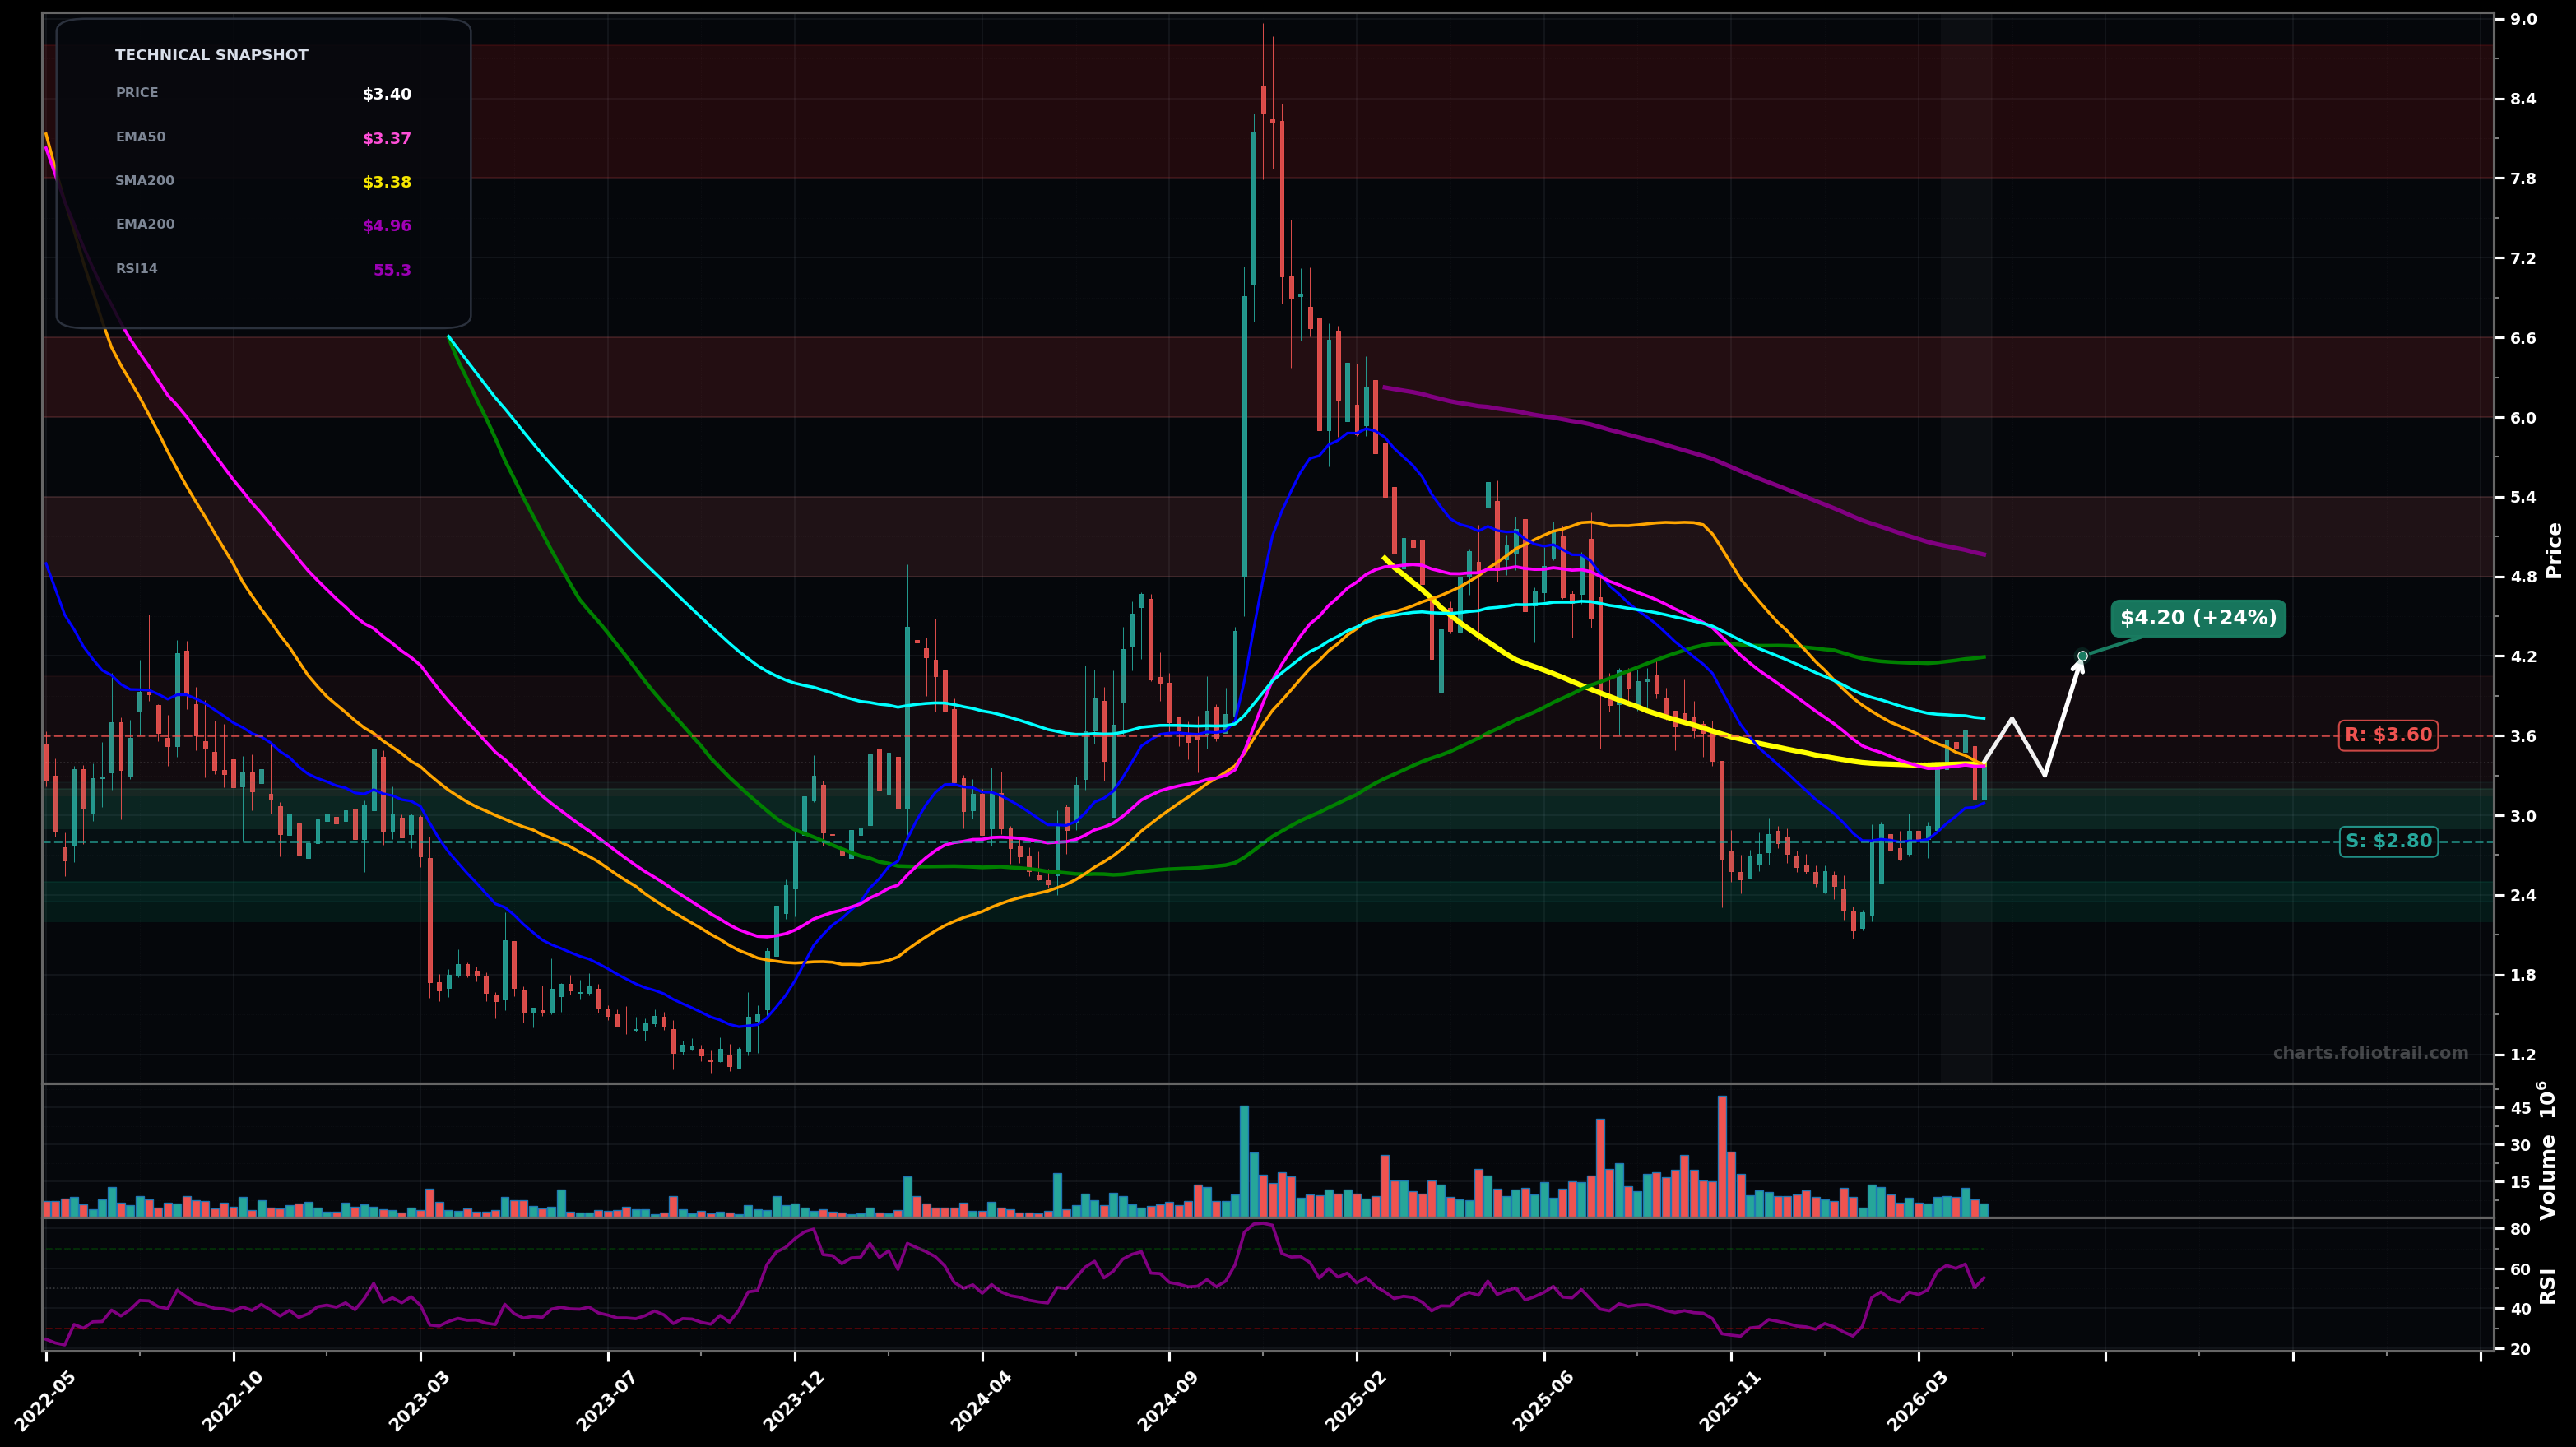
As of May 22, 2026, HNST (The Honest Company, Inc.) is in a bottoming attempt state on the weekly chart, with a confidence level of 62%. Key support is at $2.80 and key resistance at $3.60. Weekly bounced off the ~$2.4–$2.6 base and pushed back to ~$3.40, now testing the clustered EMA50/SMA50/SMA200 area (~$3.37–$3.38) from below/at.
Bullish continuation: price holds above the $3.30–$3.40 MA cluster, breaks $3.60, then grinds toward the next overhead MAs/previous breakdown zone.
Bearish failure: rejection at $3.60 / MA congestion, loss of $3.30, then retest of the base with risk of a fresh LL if $2.80 breaks.
2 weekly closes above $3.60 (hold above the MA cluster and clear near-term supply)
Weekly close back below $2.80 (breaks the recent higher-low attempt)
Scale near reclaimed MA cluster ($3.0 area); add on pullbacks into prior demand; heavy add only on deep retest/undercut of the established ~$2.4 base.
Trim into major overhead supply from the prior distribution breakdown and long-term EMA200 zone; progressively de-risk as price approaches the prior blow-off/weekly peak region.
As of May 22, 2026, HNST (The Honest Company, Inc.) is in a bottoming attempt state on the weekly chart with 62% confidence. Weekly bounced off the ~$2.4–$2.6 base and pushed back to ~$3.40, now testing the clustered EMA50/SMA50/SMA200 area (~$3.37–$3.38) from below/at.
On the weekly timeframe, HNST has key support at $2.80 and key resistance at $3.60. The most likely scenario (bullish) targets $3.73 and $4.20, with a revert level at $3.30.
HNST (The Honest Company, Inc.) is currently classified as bottoming attempt on the weekly chart, with 62% confidence. Confirmation requires: 2 weekly closes above $3.60 (hold above the MA cluster and clear near-term supply) This would be invalidated by: Weekly close back below $2.80 (breaks the recent higher-low attempt)
The most likely scenario (bullish) targets $3.73 and $4.20, with a revert level at $3.30. The alternative scenario (bearish) targets $2.80 and $2.40.
Multi-layer AI agents analyse 200+ stocks across daily, weekly, and monthly timeframes — producing market state classifications, price scenarios with targets, and position entry/exit levels. Daily charts updated every trading day at 6 PM ET. Weekly charts refresh Fridays. Monthly charts refresh on the last trading day of each month. No paywall. No sign-up required.
Built by Foliotrail.
All content on this website — including charts, analysis, price targets, support/resistance levels, and position zones — is generated entirely by AI and provided for educational and informational purposes only.
This is not financial advice. NEXUSNOIR VENTURES SL (the operator of this website) is not a registered investment adviser or broker-dealer. You should not make investment decisions based solely on this information. Always do your own research and consult a qualified financial advisor.
By continuing, you acknowledge that you have read and agree to our full disclaimer & terms of use and privacy policy.