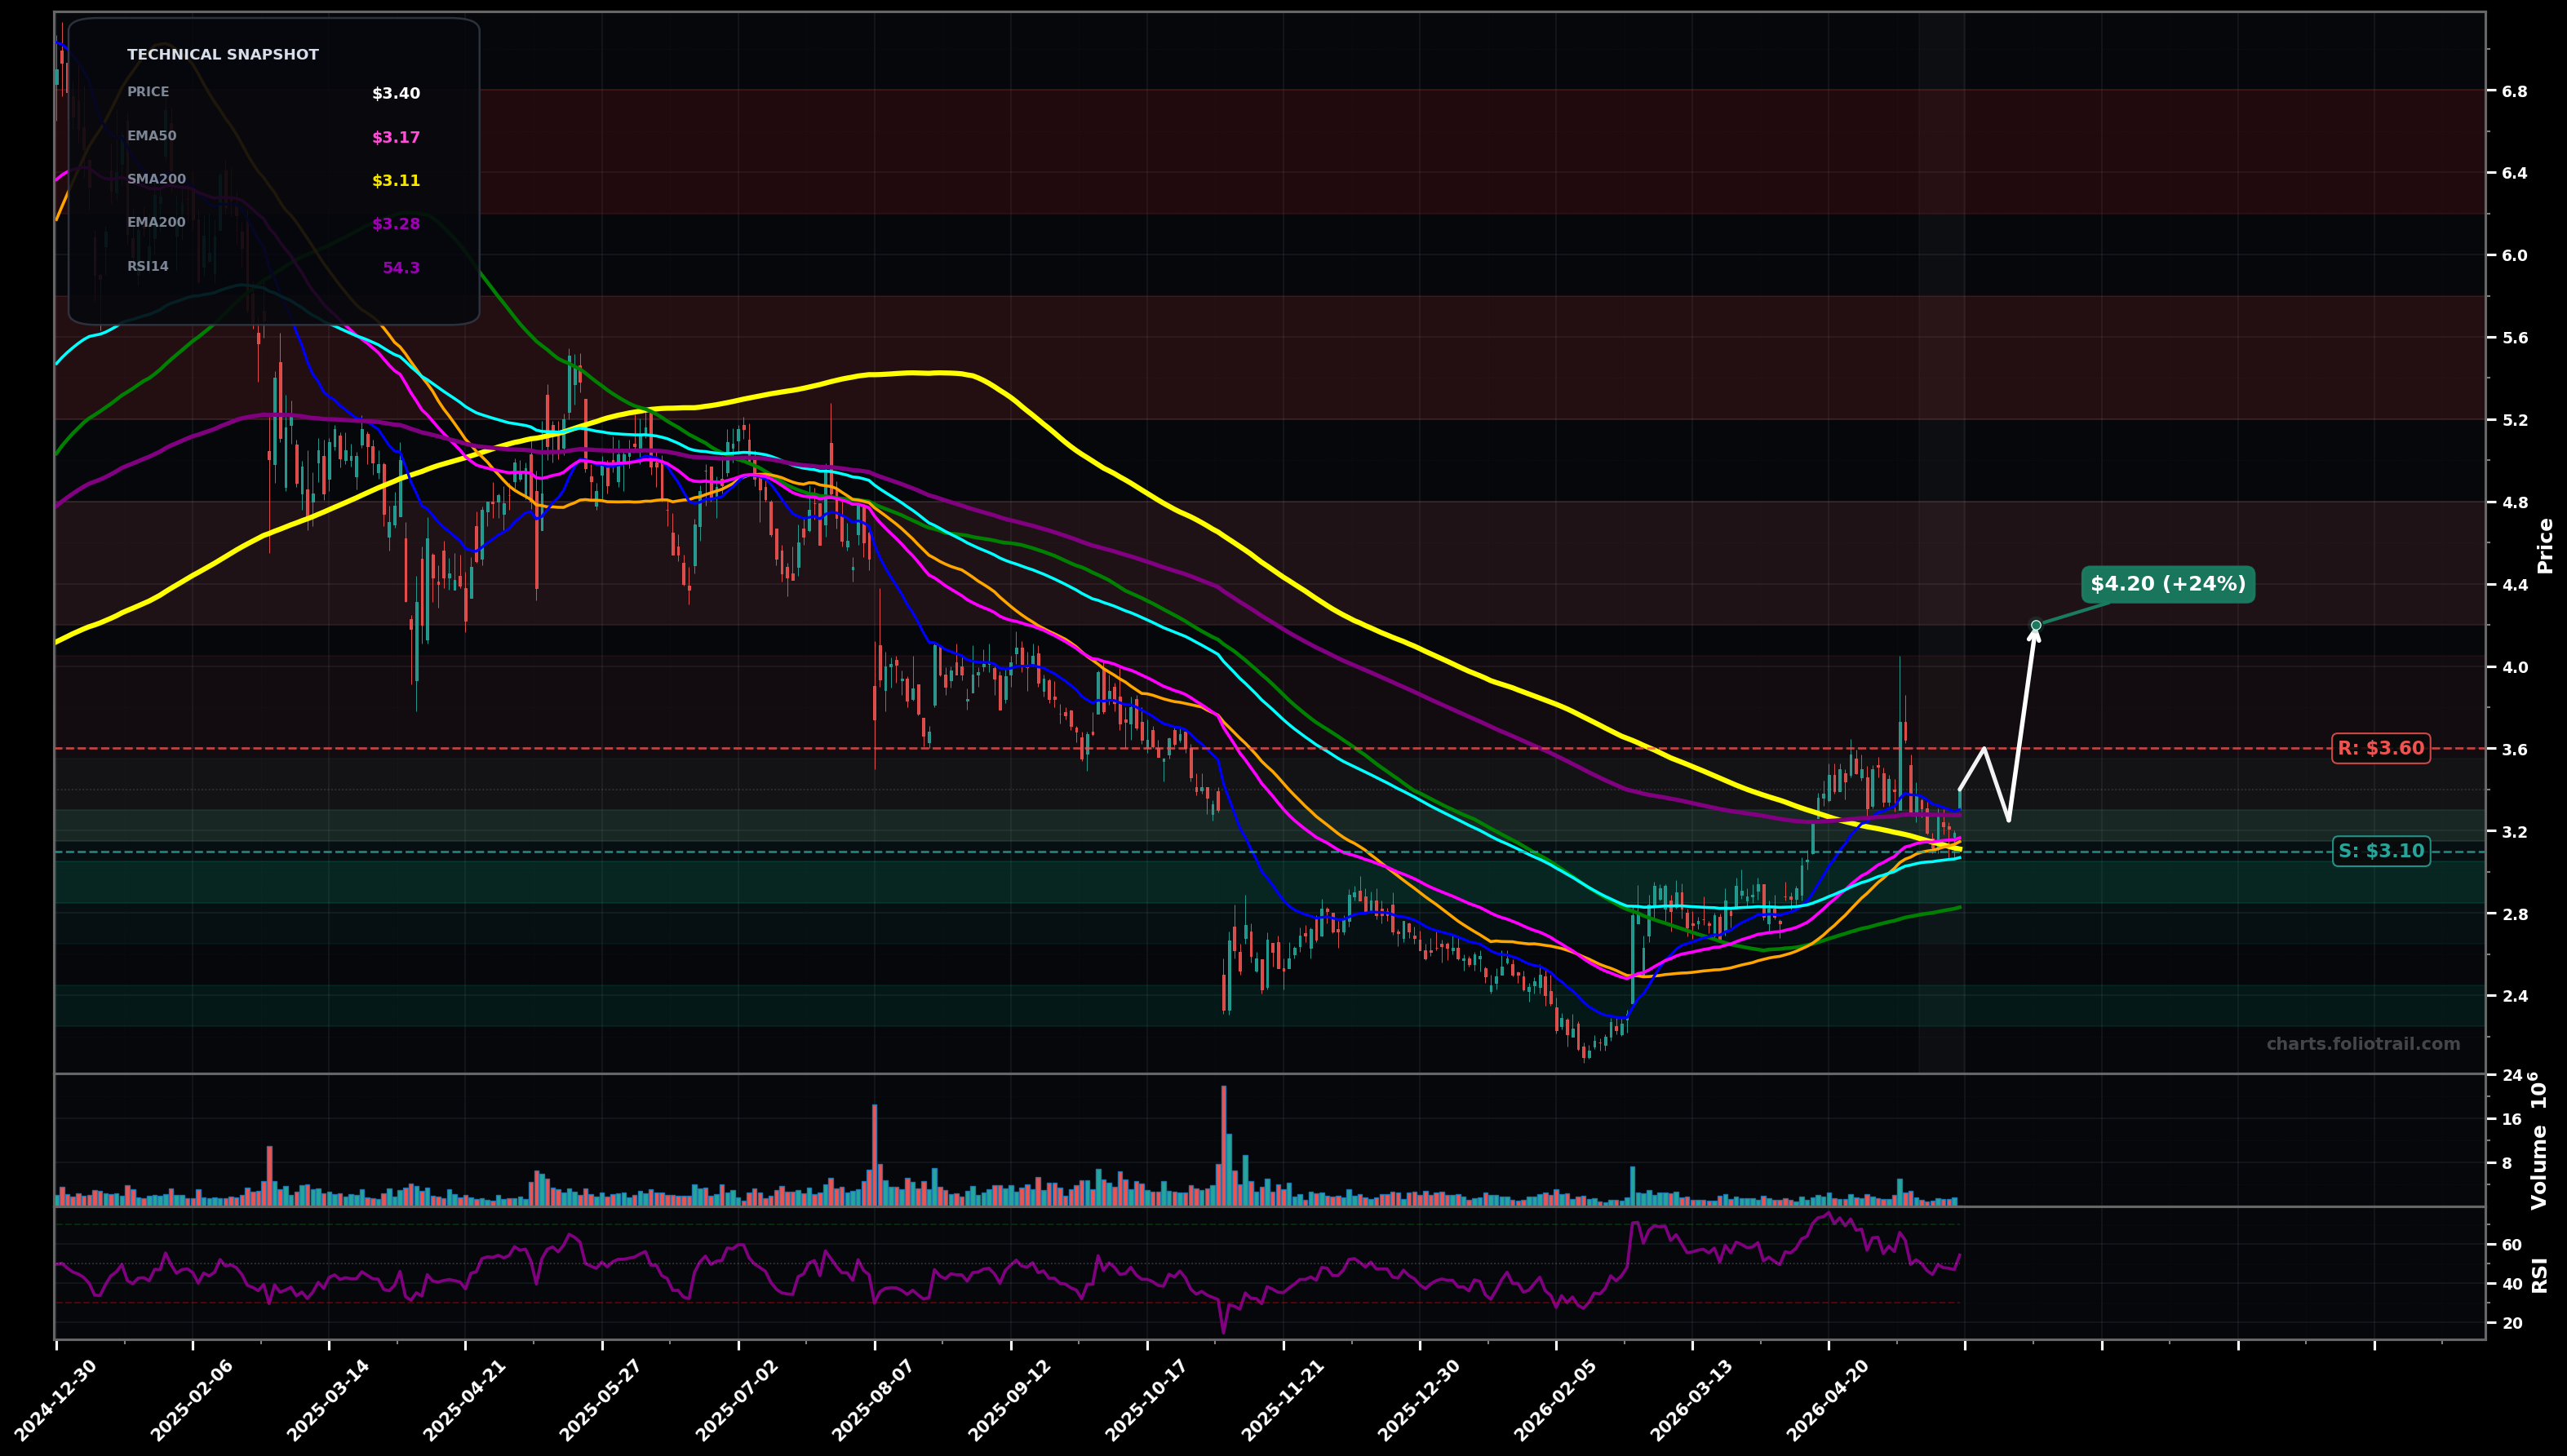
As of May 22, 2026, HNST (The Honest Company, Inc.) is in a bottoming attempt state on the daily chart, with a confidence level of 63%. Key support is at $3.10 and key resistance at $3.60. Price at ~$3.40 is consolidating just above a tight MA cluster after a rebound from the ~$2.2–$2.3 swing low; recent candles show reduced downside follow-through and RSI ~54.
Range-to-break attempt: holds $3.10–$3.20, grinds higher and challenges the April spike supply; if it clears $3.60, a continuation push targets the next overhead MA band.
Failed reclaim: rejection near $3.50–$3.60 leads to breakdown back into the base; retest of the prior swing-low zone becomes likely if $3.10 fails.
Daily close > $3.60 (clear swing-high reclaim) with follow-through (2+ closes holding).
Daily close < $3.05 (loss of EMA100 area and range floor) increases odds of retest lower.
Start near EMA50/100 reclaimed support, add on breakdown-to-support retest of $2.9–$3.0, heavy add only on deep mean-reversion into the Feb swing-low demand (~$2.3).
Trim into likely Wave-(C)/(3) retrace supply where SMA200/EMA200 and prior breakdown levels cluster; progressively higher trims into macro resistance from the prior distribution zone.
As of May 22, 2026, HNST (The Honest Company, Inc.) is in a bottoming attempt state on the daily chart with 63% confidence. Price at ~$3.40 is consolidating just above a tight MA cluster after a rebound from the ~$2.2–$2.3 swing low; recent candles show reduced downside follow-through and RSI ~54.
On the daily timeframe, HNST has key support at $3.10 and key resistance at $3.60. The most likely scenario (bullish) targets $3.60 and $4.20, with a revert level at $3.25.
HNST (The Honest Company, Inc.) is currently classified as bottoming attempt on the daily chart, with 63% confidence. Confirmation requires: Daily close > $3.60 (clear swing-high reclaim) with follow-through (2+ closes holding). This would be invalidated by: Daily close < $3.05 (loss of EMA100 area and range floor) increases odds of retest lower.
The most likely scenario (bullish) targets $3.60 and $4.20, with a revert level at $3.25. The alternative scenario (bearish) targets $2.80 and $2.30.
Multi-layer AI agents analyse 200+ stocks across daily, weekly, and monthly timeframes — producing market state classifications, price scenarios with targets, and position entry/exit levels. Daily charts updated every trading day at 6 PM ET. Weekly charts refresh Fridays. Monthly charts refresh on the last trading day of each month. No paywall. No sign-up required.
Built by Foliotrail.
All content on this website — including charts, analysis, price targets, support/resistance levels, and position zones — is generated entirely by AI and provided for educational and informational purposes only.
This is not financial advice. NEXUSNOIR VENTURES SL (the operator of this website) is not a registered investment adviser or broker-dealer. You should not make investment decisions based solely on this information. Always do your own research and consult a qualified financial advisor.
By continuing, you acknowledge that you have read and agree to our full disclaimer & terms of use and privacy policy.