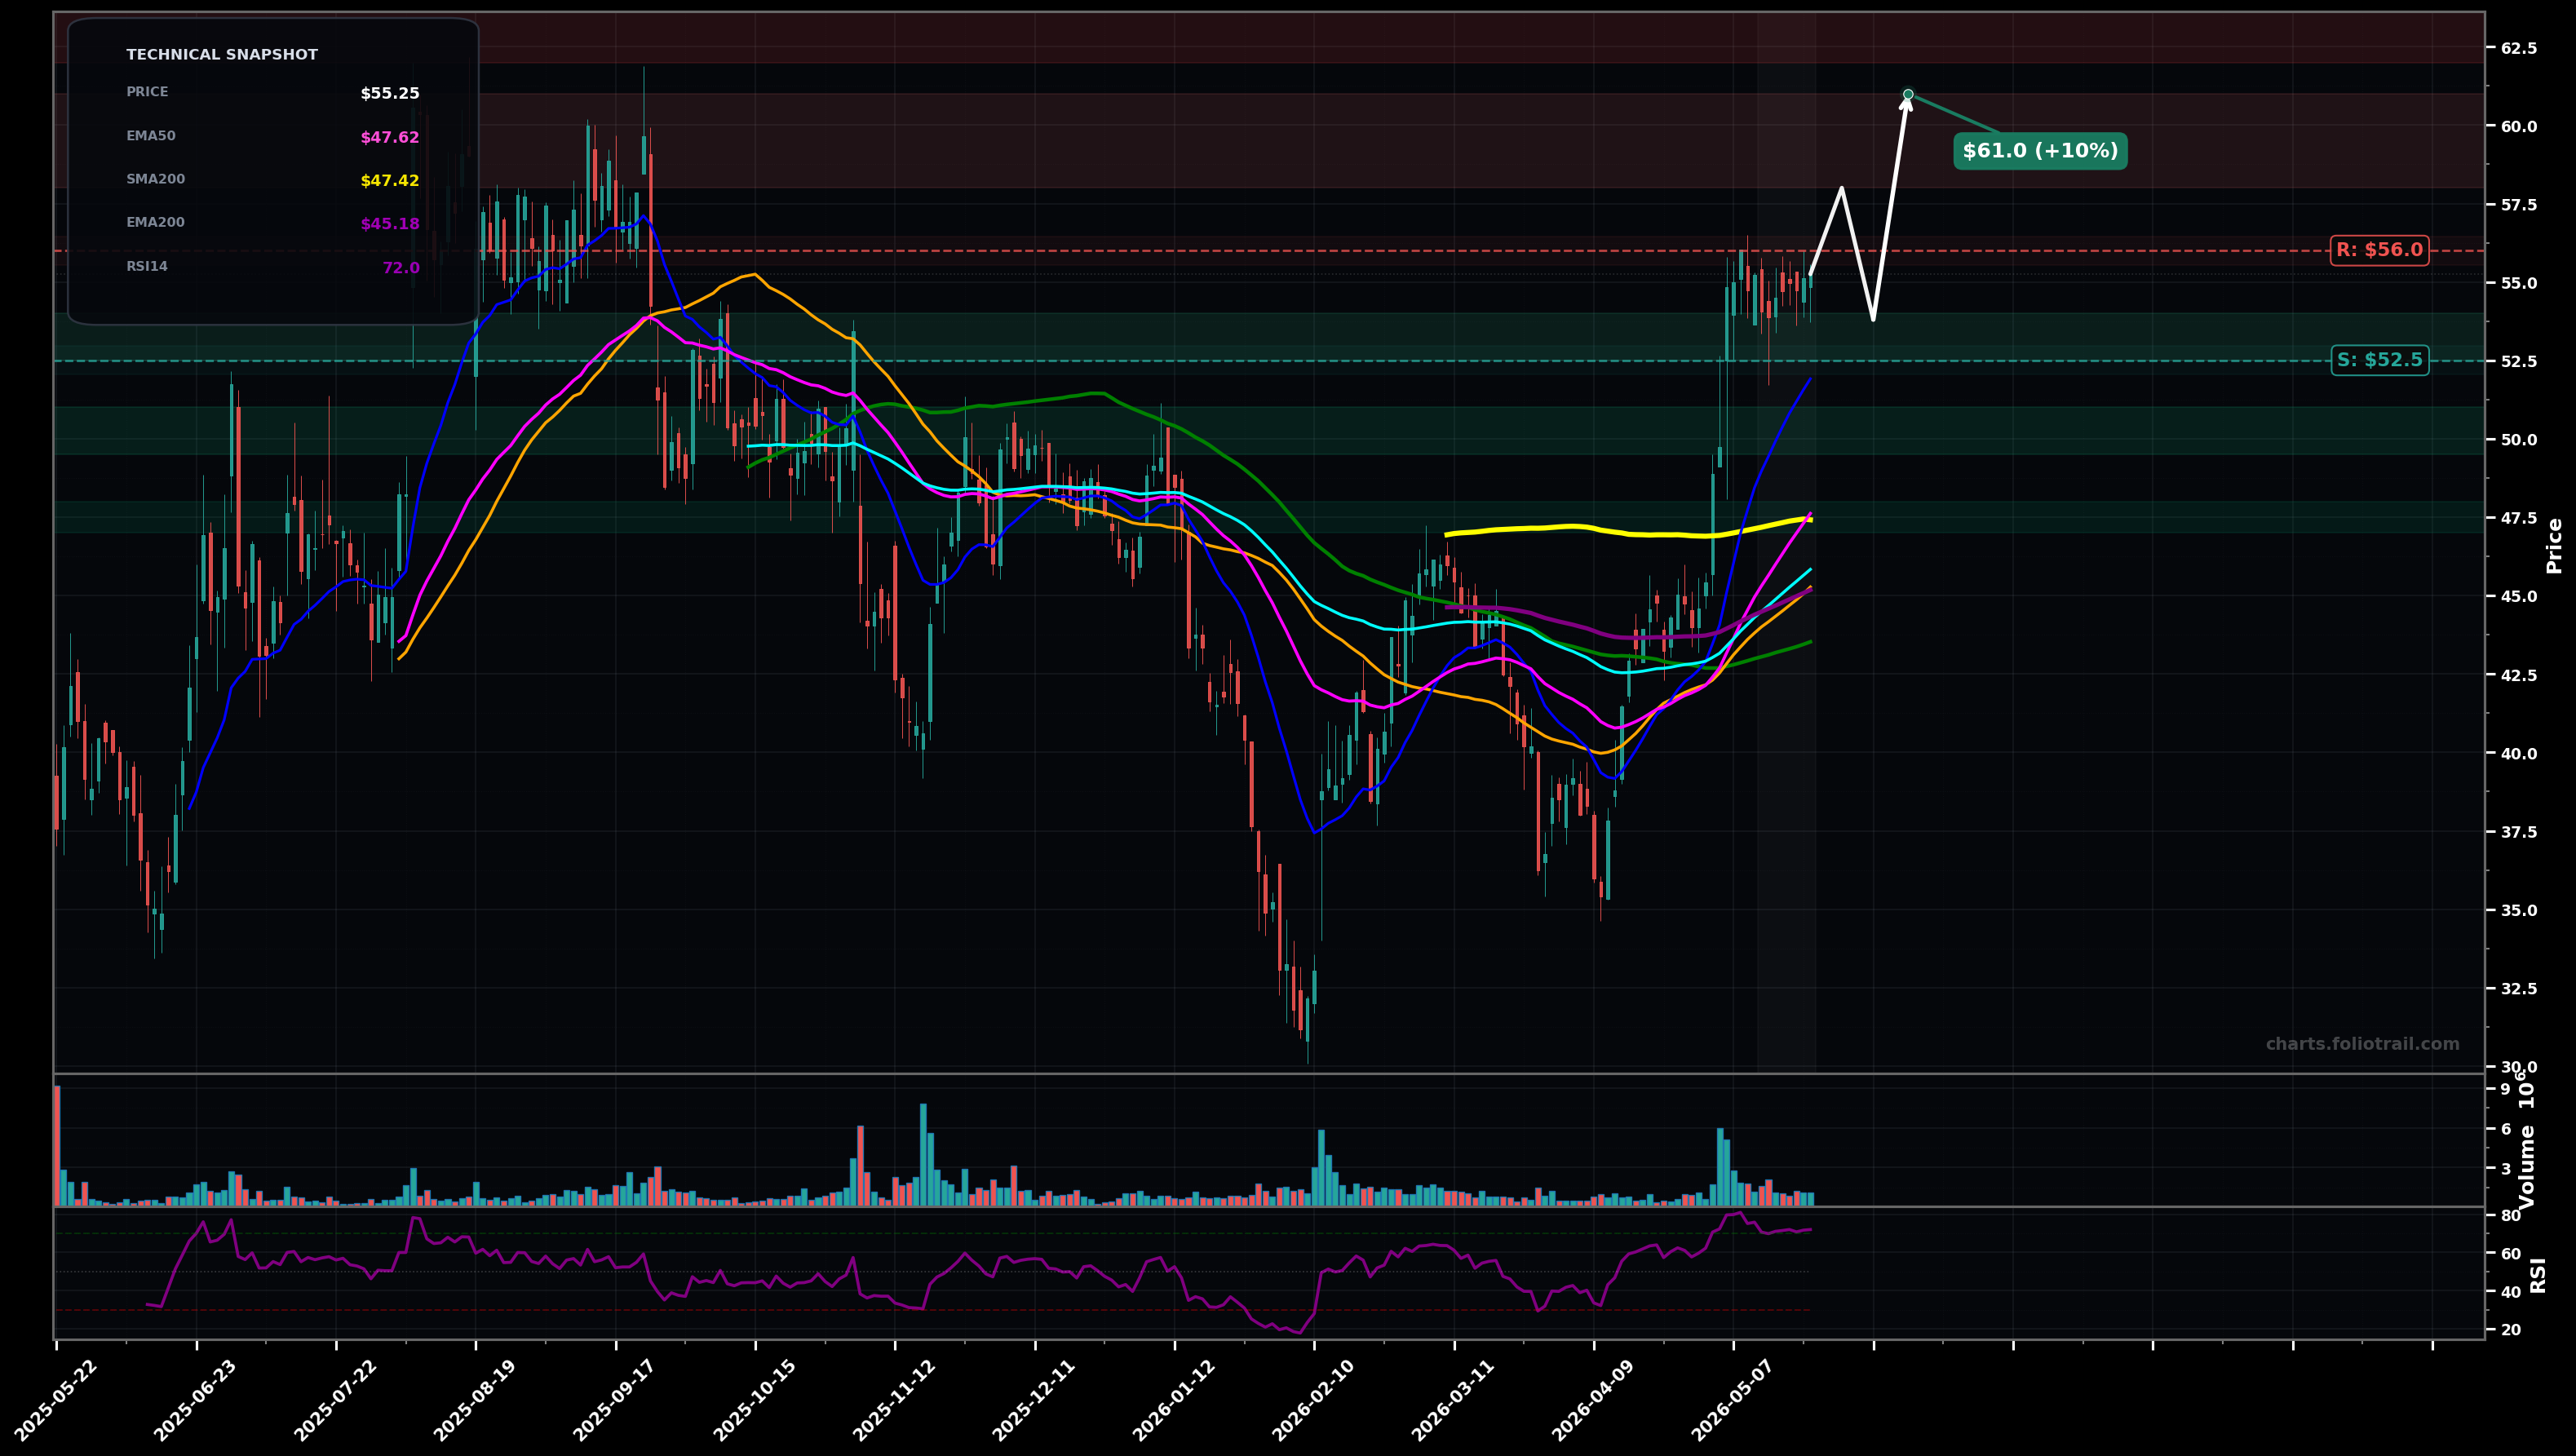
As of May 22, 2026, HNGE (Hinge Health Inc.) is in a breakout reversal state on the daily chart, with a confidence level of 72%. Key support is at $52.5 and key resistance at $56.0. Sharp breakout and gap-like impulse from the mid-$40s to ~$55, now consolidating tightly near highs; RSI ~72 (overbought/strong momentum) with price holding above all key MAs and reclaiming the $47-$48 long ceiling (SMA200).
Bull flag continuation: hold above ~$52.5-$53, then push through ~$56 to extend the impulse leg; measured move targets align with Fib extension from the ~$36 swing low to the ~$47 breakout zone.
Post-breakout pullback: momentum cools (RSI mean reversion) and price retests the reclaimed MA cluster/SMA200 zone; if defended, it becomes a higher low and sets up another attempt higher; if it fails, breakout becomes a bull trap.
Daily close > $56.00 with follow-through (next close holding above $56.00)
Daily close < $52.50 (loss of the breakout hold zone and EMA20 area)
Start on pullbacks into the breakout hold ($52.5-$54); add on deeper retrace toward prior pivot/EMA100 area (~$50); heavy add on clean retest of reclaimed SMA200/major resistance-turned-support (~$47-$48).
Trim into extension targets after the breakout (likely wave-3 style impulse); increase trimming as price becomes stretched above rising MAs and into Fib extension/psychological levels; fully close only if a major multi-year overextension occurs.
As of May 22, 2026, HNGE (Hinge Health Inc.) is in a breakout reversal state on the daily chart with 72% confidence. Sharp breakout and gap-like impulse from the mid-$40s to ~$55, now consolidating tightly near highs; RSI ~72 (overbought/strong momentum) with price holding above all key MAs and reclaiming the $47-$48 long ceiling (SMA200).
On the daily timeframe, HNGE has key support at $52.5 and key resistance at $56.0. The most likely scenario (bullish) targets $58.0 and $61.0, with a revert level at $53.8.
HNGE (Hinge Health Inc.) is currently classified as breakout reversal on the daily chart, with 72% confidence. Confirmation requires: Daily close > $56.00 with follow-through (next close holding above $56.00) This would be invalidated by: Daily close < $52.50 (loss of the breakout hold zone and EMA20 area)
The most likely scenario (bullish) targets $58.0 and $61.0, with a revert level at $53.8. The alternative scenario (bearish) targets $50.0 and $47.5.
Multi-layer AI agents analyse 200+ stocks across daily, weekly, and monthly timeframes — producing market state classifications, price scenarios with targets, and position entry/exit levels. Daily charts updated every trading day at 6 PM ET. Weekly charts refresh Fridays. Monthly charts refresh on the last trading day of each month. No paywall. No sign-up required.
Built by Foliotrail.
All content on this website — including charts, analysis, price targets, support/resistance levels, and position zones — is generated entirely by AI and provided for educational and informational purposes only.
This is not financial advice. NEXUSNOIR VENTURES SL (the operator of this website) is not a registered investment adviser or broker-dealer. You should not make investment decisions based solely on this information. Always do your own research and consult a qualified financial advisor.
By continuing, you acknowledge that you have read and agree to our full disclaimer & terms of use and privacy policy.