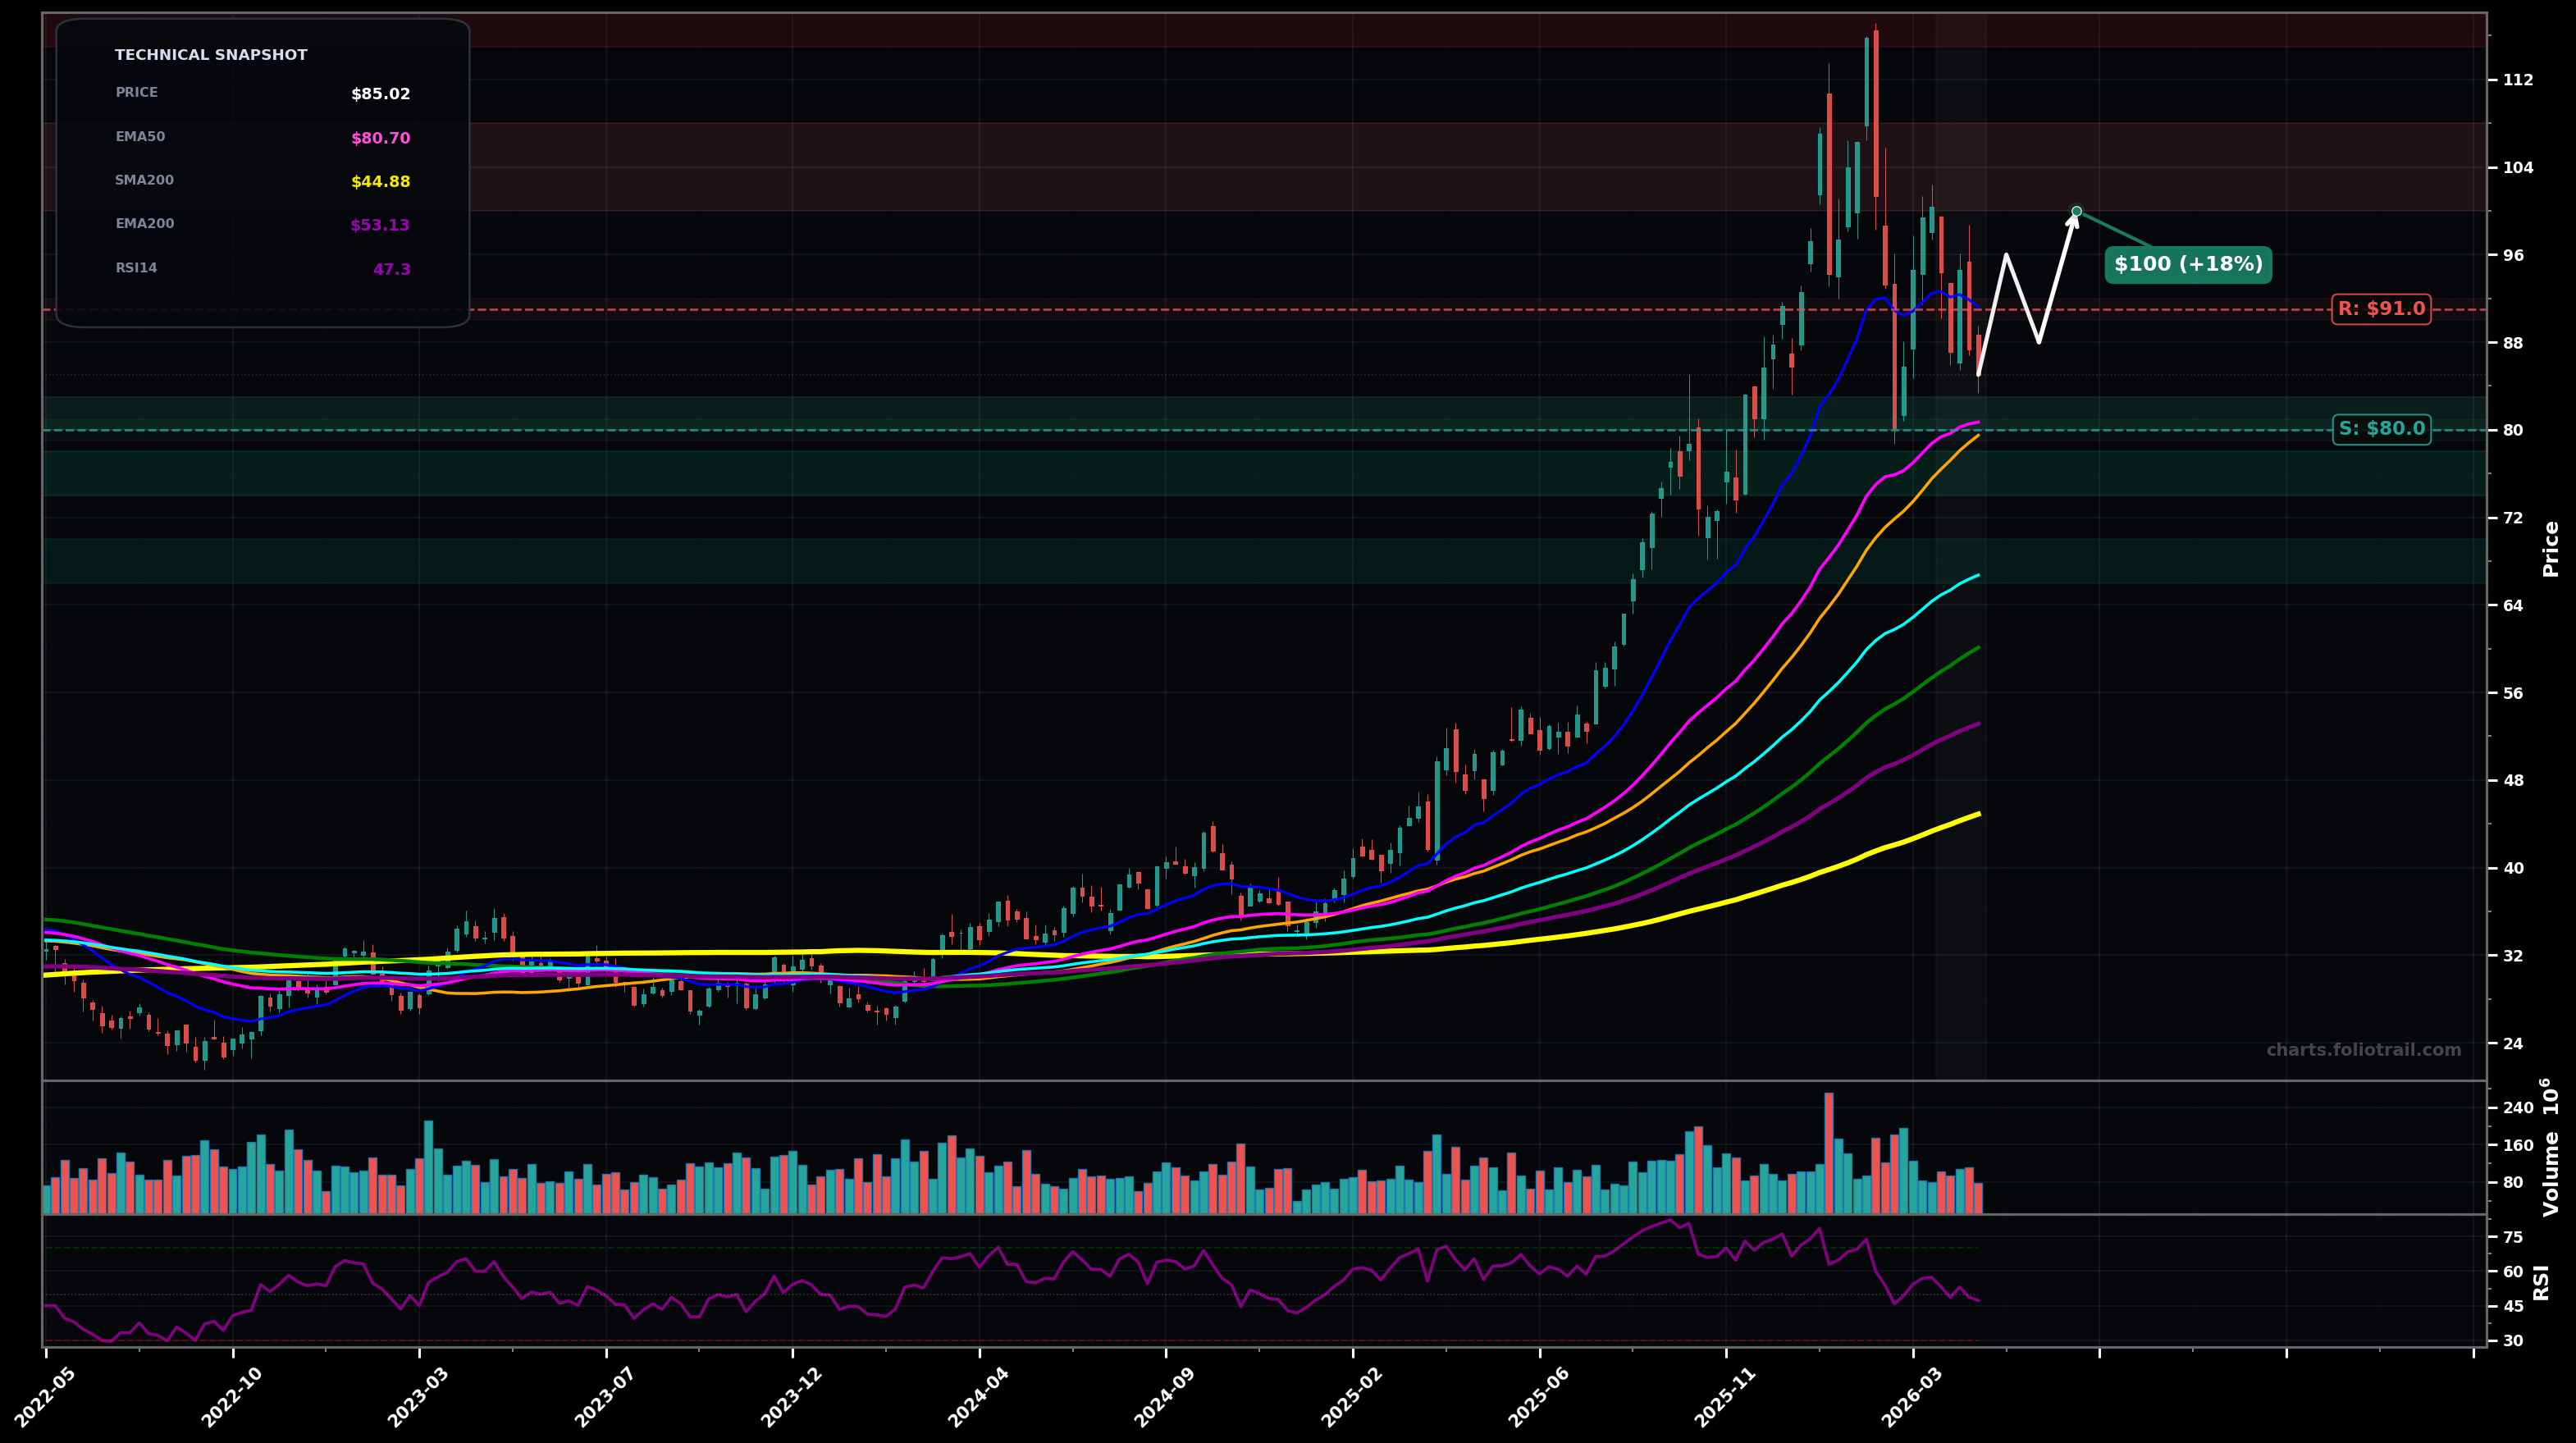
As of May 22, 2026, GDX (VanEck Gold Miners ETF) is in a bottoming attempt state on the weekly chart, with a confidence level of 56%. Key support is at $80.0 and key resistance at $91.0. Weekly pullback from the ~$110+ peak; price at ~$85 is below EMA20 (~$91) but still above EMA50 (~$81) with momentum cooling (RSI ~47).
Base-and-bounce: hold the EMA50/$80 area, reclaim EMA20 (~$91), then rotate to retest the prior breakdown zone near the mid-$90s and potentially the psychological $100 area.
Deeper corrective leg: lose EMA50 support and flush toward the next confluence zone (prior breakout area + rising longer MAs), then attempt a larger-degree Wave-4 style base.
2 weekly closes back above ~$91 (EMA20 area) and then a break/close above ~$96 would confirm stabilization and trend resumption.
Weekly close below ~$80 would invalidate the bottoming attempt and tilt back to a deeper correction.
Buy zones are mapped to (1) EMA50 support, (2) prior breakout/structure shelf and likely Fib retrace region, (3) EMA100 (~$66.7) confluence for a deeper Wave-4 style correction.
Trim into retests/overextensions near the prior top zone (~$110+) and potential Fib extensions where weekly price tends to get stretched above rising MAs and reversal risk increases.
As of May 22, 2026, GDX (VanEck Gold Miners ETF) is in a bottoming attempt state on the weekly chart with 56% confidence. Weekly pullback from the ~$110+ peak; price at ~$85 is below EMA20 (~$91) but still above EMA50 (~$81) with momentum cooling (RSI ~47).
On the weekly timeframe, GDX has key support at $80.0 and key resistance at $91.0. The most likely scenario (bullish) targets $96.0 and $100, with a revert level at $88.0.
GDX (VanEck Gold Miners ETF) is currently classified as bottoming attempt on the weekly chart, with 56% confidence. Confirmation requires: 2 weekly closes back above ~$91 (EMA20 area) and then a break/close above ~$96 would confirm stabilization and trend resumption. This would be invalidated by: Weekly close below ~$80 would invalidate the bottoming attempt and tilt back to a deeper correction.
The most likely scenario (bullish) targets $96.0 and $100, with a revert level at $88.0. The alternative scenario (bearish) targets $74.0 and $67.0.
Multi-layer AI agents analyse 200+ stocks across daily, weekly, and monthly timeframes — producing market state classifications, price scenarios with targets, and position entry/exit levels. Daily charts updated every trading day at 6 PM ET. Weekly charts refresh Fridays. Monthly charts refresh on the last trading day of each month. No paywall. No sign-up required.
Built by Foliotrail.
All content on this website — including charts, analysis, price targets, support/resistance levels, and position zones — is generated entirely by AI and provided for educational and informational purposes only.
This is not financial advice. NEXUSNOIR VENTURES SL (the operator of this website) is not a registered investment adviser or broker-dealer. You should not make investment decisions based solely on this information. Always do your own research and consult a qualified financial advisor.
By continuing, you acknowledge that you have read and agree to our full disclaimer & terms of use and privacy policy.