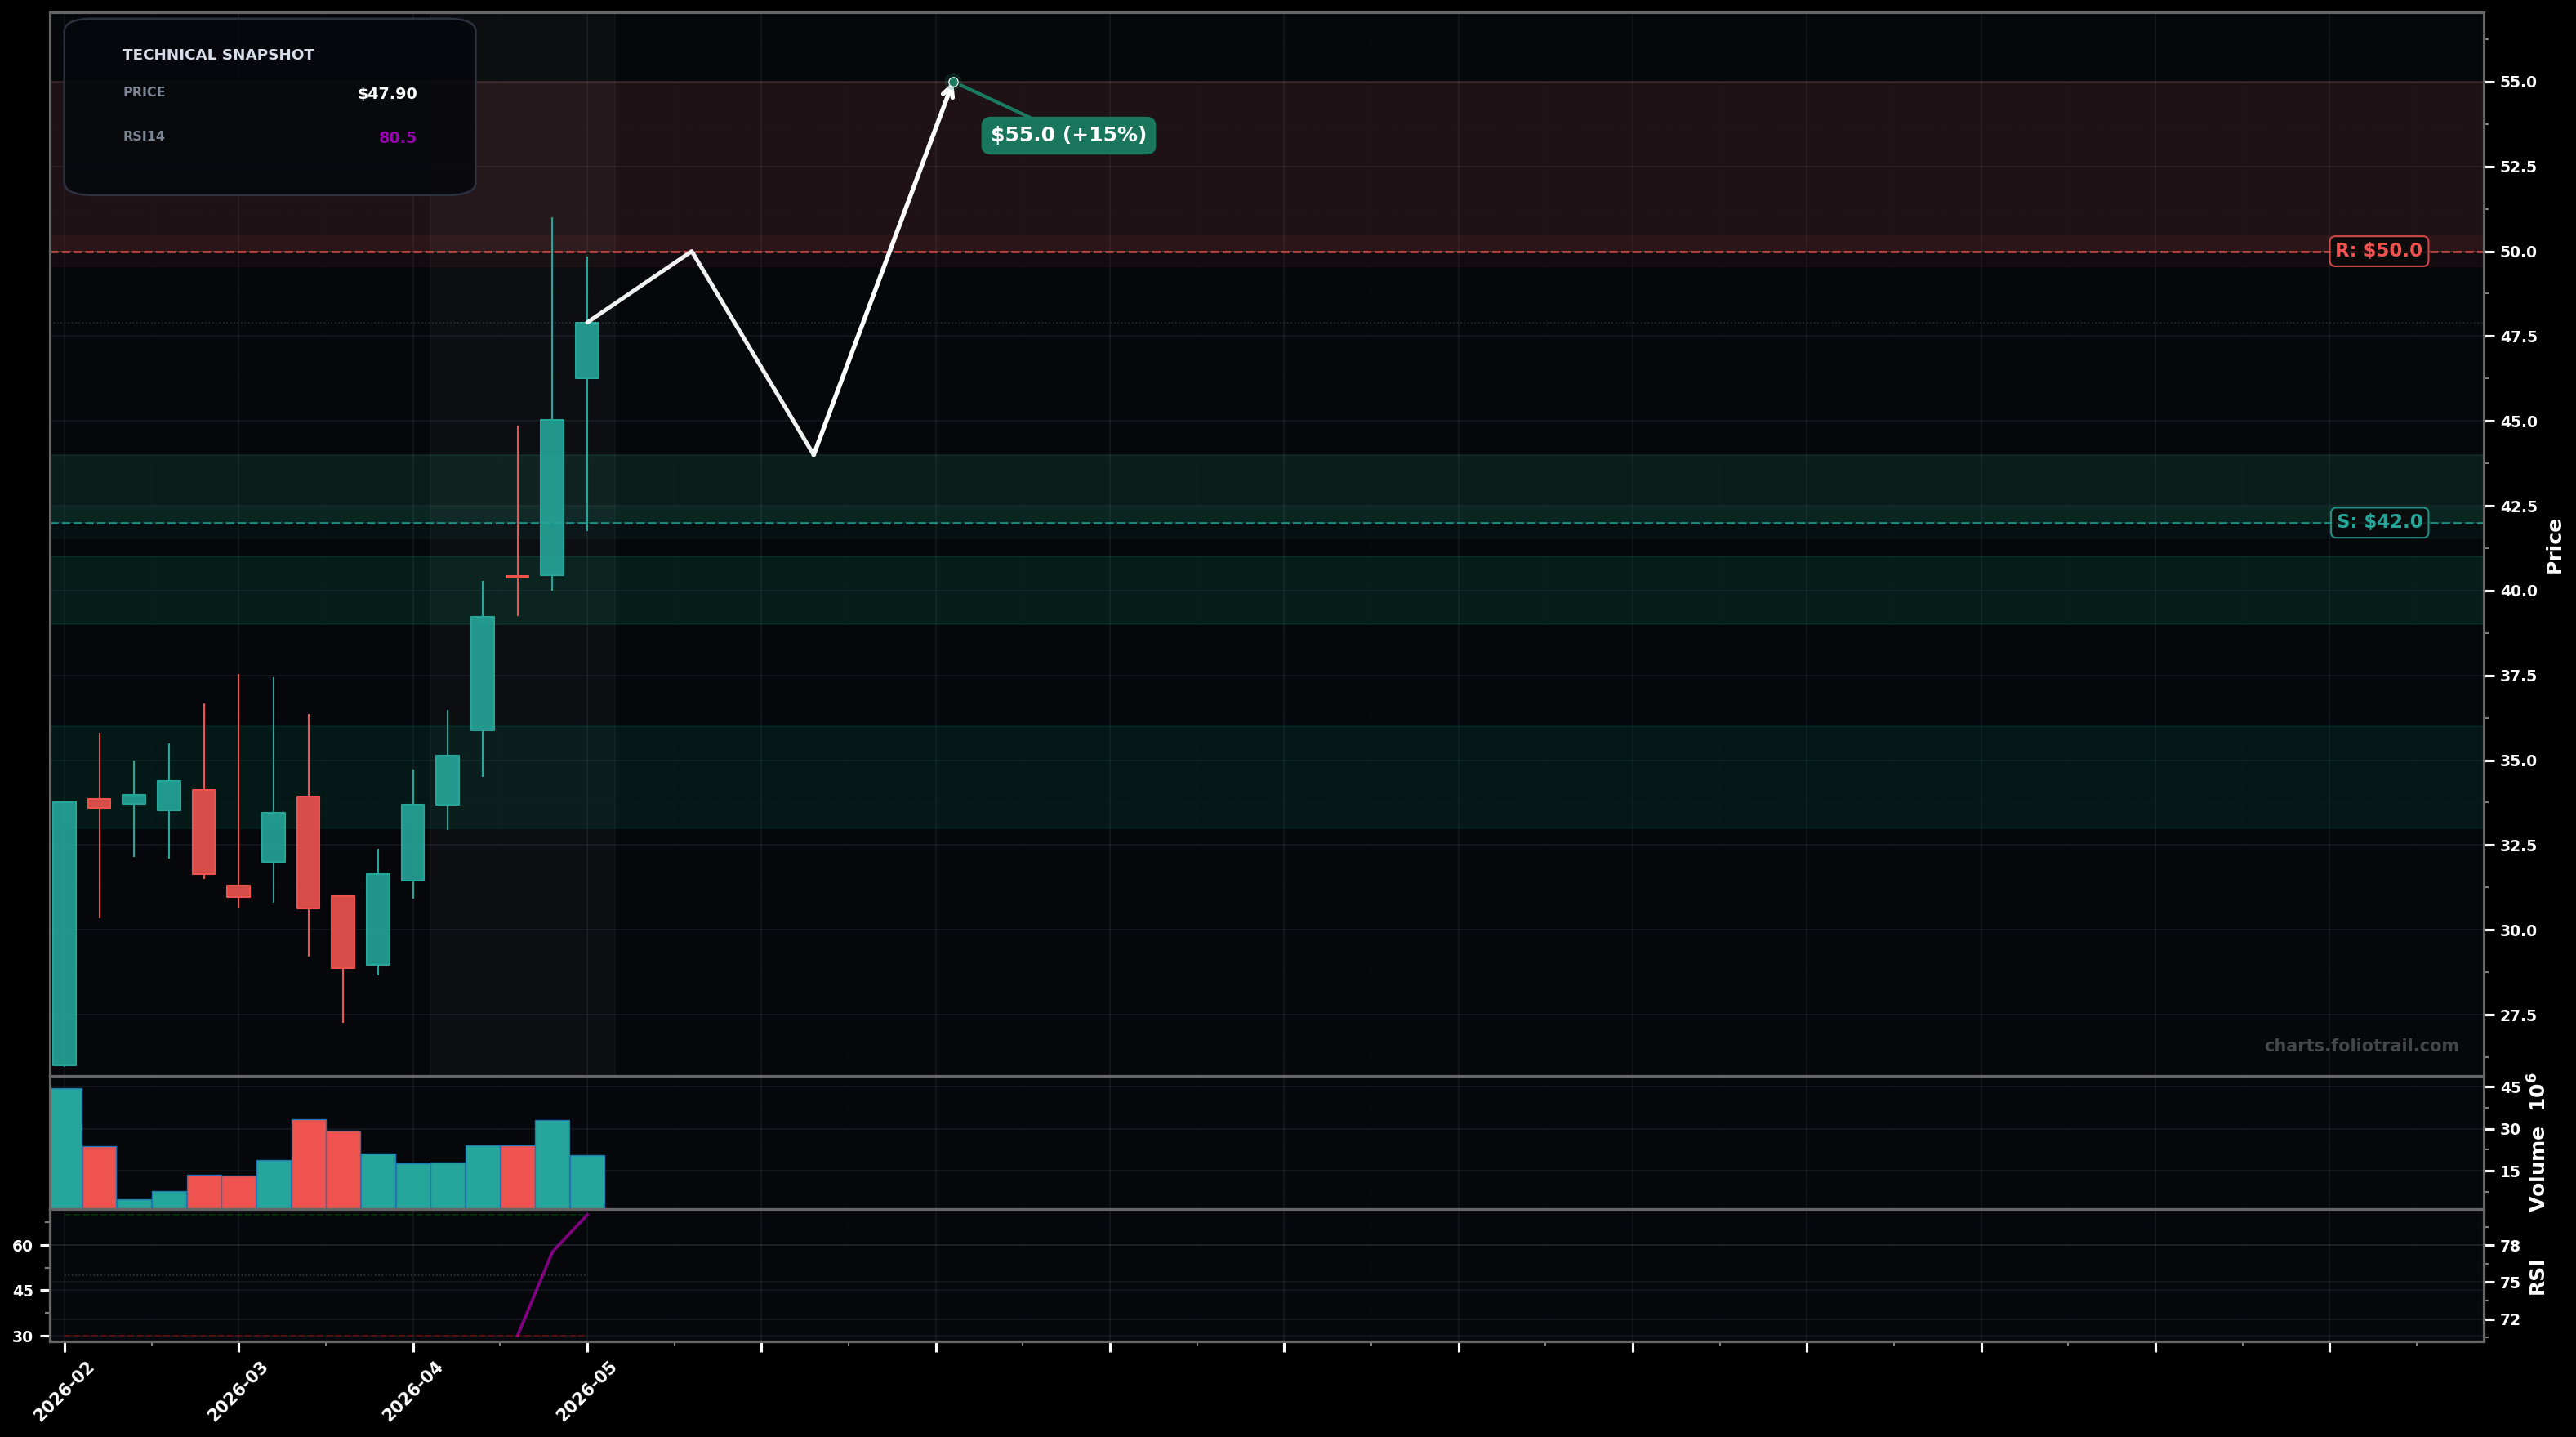
As of May 22, 2026, FPS (Forgent Power Solutions, Inc.) is in a uptrend state on the weekly chart, with a confidence level of 74%. Key support is at $42.0 and key resistance at $50.0. Strong weekly impulse rally to ~$47.90 with successive HH/HL; RSI-14 ~80 (overbought) and upper-wick volatility near the highs suggests near-term pullback risk while trend remains up.
Bullish continuation after a shallow digestion: price consolidates above ~$42 (prior breakout zone) then pushes to a new high; Elliott wave read = late Wave 3 or early Wave 5 extension, so upside is plausible but more two-sided candles expected.
Mean-reversion pullback from overbought conditions: a deeper retrace toward the prior base/impulse origin, then attempt to re-accumulate; Elliott wave alt = Wave 4 pullback before a final push.
Weekly close above $50.00
Weekly close below $42.00
Buy-the-dip zones mapped to prior breakout/swing structure: ~$42-$44 = first HL retest, ~$39-$41 = deeper support under breakout, ~$33-$36 = prior consolidation/impulse base area (higher reward if reached).
RSI/impulse suggests late-trend stretch: trim into round-number resistance ($50+) and potential fib extensions; progressively reduce as price moves further from the last breakout base (higher reversal risk).
As of May 22, 2026, FPS (Forgent Power Solutions, Inc.) is in a uptrend state on the weekly chart with 74% confidence. Strong weekly impulse rally to ~$47.90 with successive HH/HL; RSI-14 ~80 (overbought) and upper-wick volatility near the highs suggests near-term pullback risk while trend remains up.
On the weekly timeframe, FPS has key support at $42.0 and key resistance at $50.0. The most likely scenario (bullish) targets $50.0 and $55.0, with a revert level at $44.0.
FPS (Forgent Power Solutions, Inc.) is currently classified as uptrend on the weekly chart, with 74% confidence. Confirmation requires: Weekly close above $50.00 This would be invalidated by: Weekly close below $42.00
The most likely scenario (bullish) targets $50.0 and $55.0, with a revert level at $44.0. The alternative scenario (bearish) targets $40.0 and $34.0.
Multi-layer AI agents analyse 200+ stocks across daily, weekly, and monthly timeframes — producing market state classifications, price scenarios with targets, and position entry/exit levels. Daily charts updated every trading day at 6 PM ET. Weekly charts refresh Fridays. Monthly charts refresh on the last trading day of each month. No paywall. No sign-up required.
Built by Foliotrail.
All content on this website — including charts, analysis, price targets, support/resistance levels, and position zones — is generated entirely by AI and provided for educational and informational purposes only.
This is not financial advice. NEXUSNOIR VENTURES SL (the operator of this website) is not a registered investment adviser or broker-dealer. You should not make investment decisions based solely on this information. Always do your own research and consult a qualified financial advisor.
By continuing, you acknowledge that you have read and agree to our full disclaimer & terms of use and privacy policy.