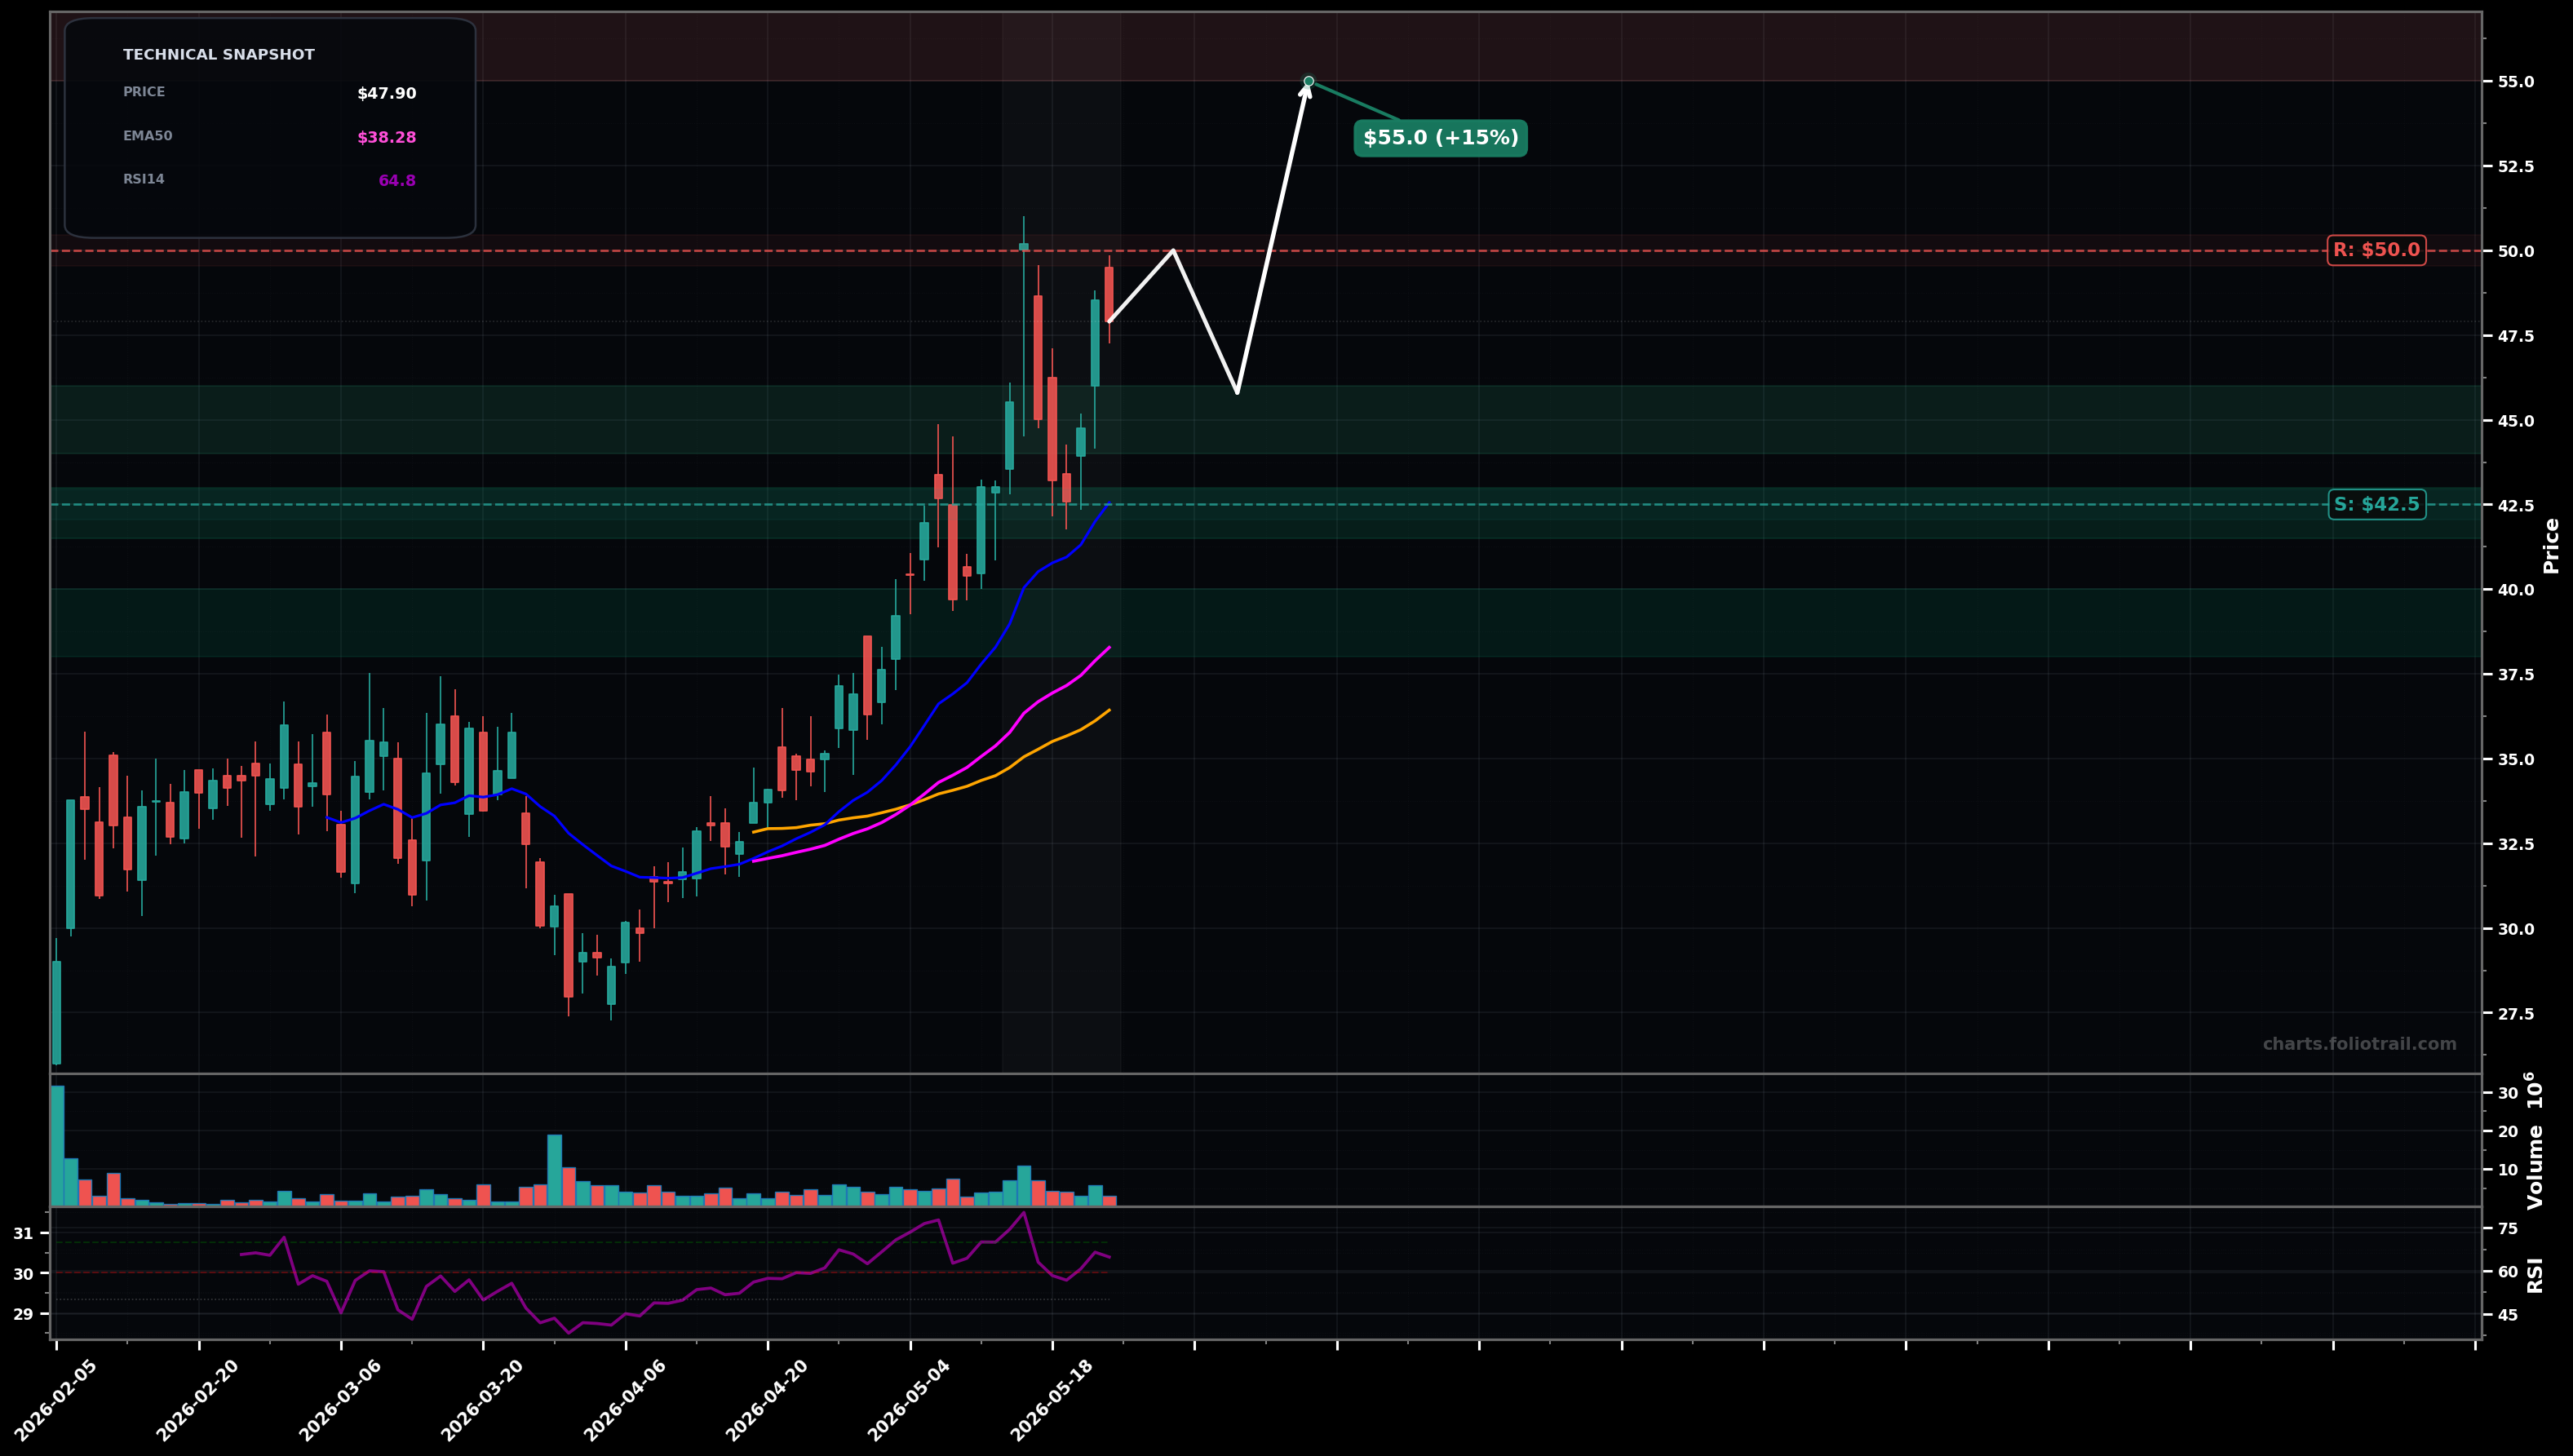
As of May 22, 2026, FPS (Forgent Power Solutions, Inc.) is in a uptrend state on the daily chart, with a confidence level of 72%. Key support is at $42.5 and key resistance at $50.0. Price at $47.90 after a strong HH/HL advance; recent pullback from the ~$50 swing high and quick rebound, holding above the rising EMA50 (~$38.28) and EMA200 (~$42.56); RSI ~64 still constructive.
Bullish continuation: price consolidates above the ~$45–$46 area then re-tests $50; a breakout can extend toward Fib extension targets.
Deeper pullback within the uptrend: rejection at ~$50 leads to a retrace toward the rising EMA200/previous breakout area, then attempt to base and re-advance.
2 consecutive daily closes above $50.00
Daily close below $42.50 (loss of EMA200 area + prior breakout zone)
Buy-the-dip structure: start near prior breakout/pullback support (~$45), add at EMA200 zone (~$42–$43), heavy add near EMA50/major trend support (~$38–$40) if volatility expands.
Trim into strength at likely Fib-extension/round-number overhead supply (post-$50 breakout); escalate trimming as price gets increasingly extended above rising trend MAs.
As of May 22, 2026, FPS (Forgent Power Solutions, Inc.) is in a uptrend state on the daily chart with 72% confidence. Price at $47.90 after a strong HH/HL advance; recent pullback from the ~$50 swing high and quick rebound, holding above the rising EMA50 (~$38.28) and EMA200 (~$42.56); RSI ~64 still constructive.
On the daily timeframe, FPS has key support at $42.5 and key resistance at $50.0. The most likely scenario (bullish) targets $50.0 and $55.0, with a revert level at $45.8.
FPS (Forgent Power Solutions, Inc.) is currently classified as uptrend on the daily chart, with 72% confidence. Confirmation requires: 2 consecutive daily closes above $50.00 This would be invalidated by: Daily close below $42.50 (loss of EMA200 area + prior breakout zone)
The most likely scenario (bullish) targets $50.0 and $55.0, with a revert level at $45.8. The alternative scenario (bearish) targets $44.0 and $40.0.
Multi-layer AI agents analyse 200+ stocks across daily, weekly, and monthly timeframes — producing market state classifications, price scenarios with targets, and position entry/exit levels. Daily charts updated every trading day at 6 PM ET. Weekly charts refresh Fridays. Monthly charts refresh on the last trading day of each month. No paywall. No sign-up required.
Built by Foliotrail.
All content on this website — including charts, analysis, price targets, support/resistance levels, and position zones — is generated entirely by AI and provided for educational and informational purposes only.
This is not financial advice. NEXUSNOIR VENTURES SL (the operator of this website) is not a registered investment adviser or broker-dealer. You should not make investment decisions based solely on this information. Always do your own research and consult a qualified financial advisor.
By continuing, you acknowledge that you have read and agree to our full disclaimer & terms of use and privacy policy.