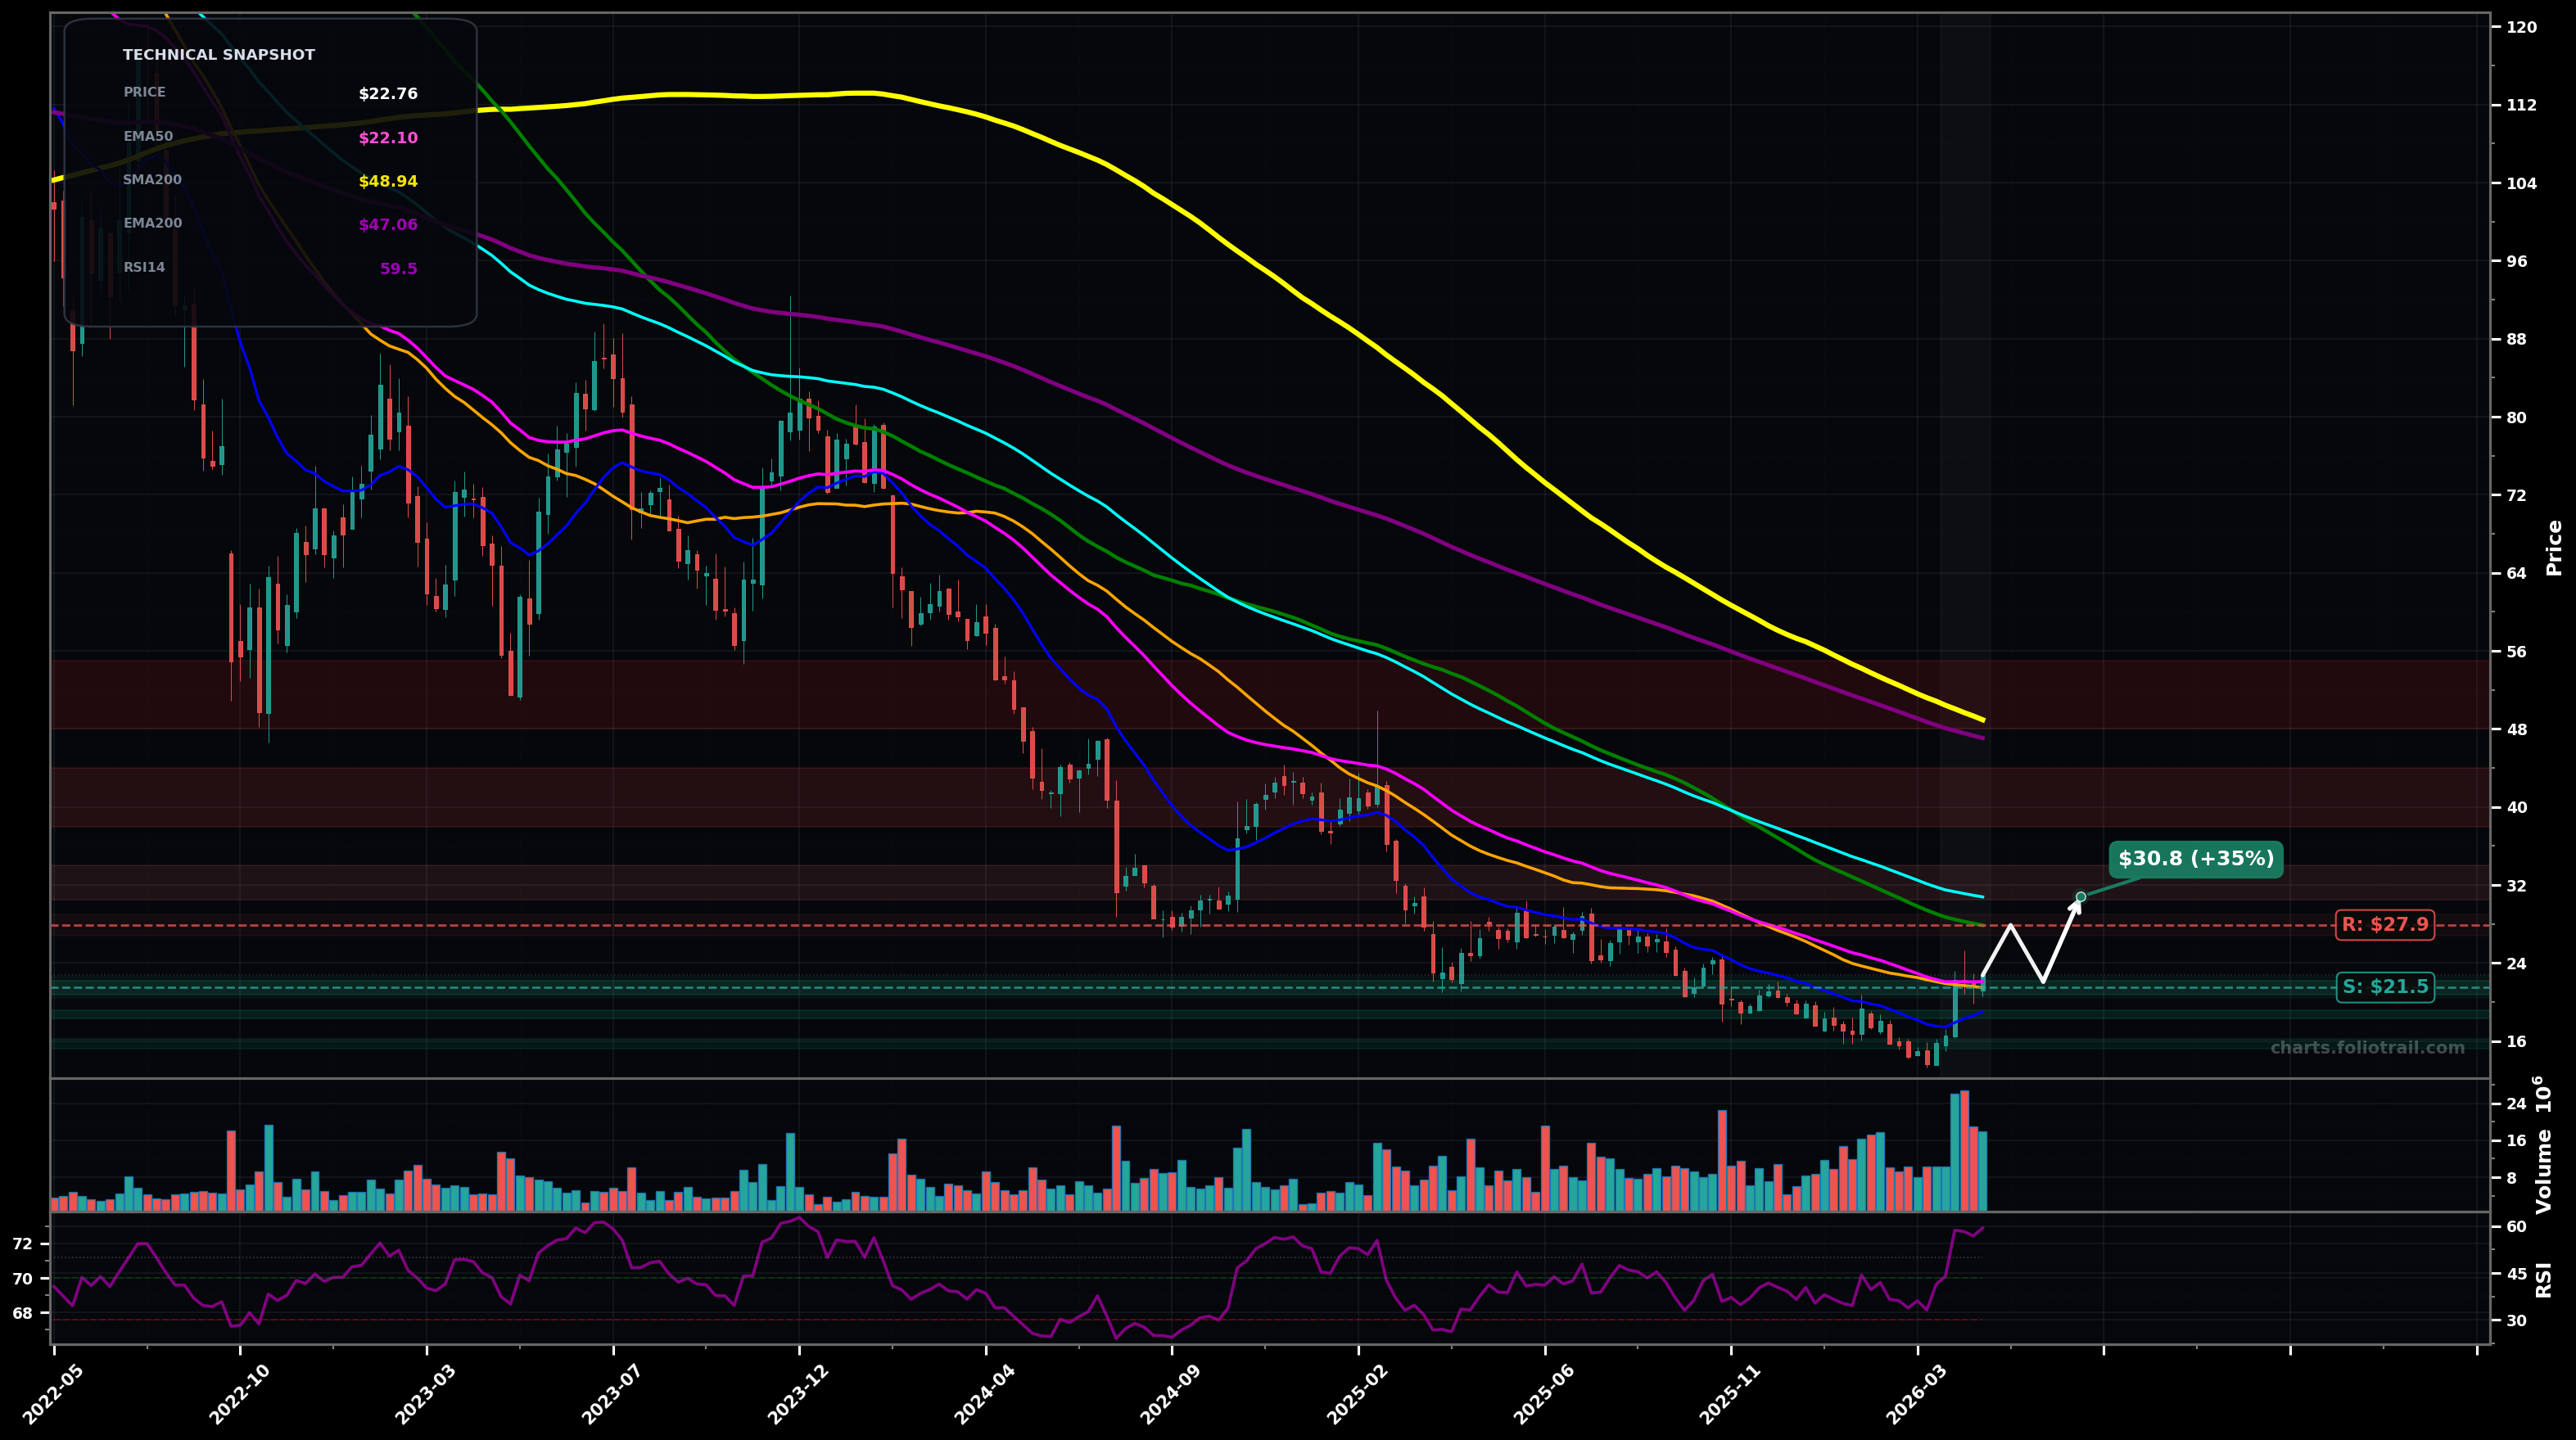
As of May 22, 2026, FIVN (Five9 Inc.) is in a bottoming attempt state on the weekly chart, with a confidence level of 63%. Key support is at $21.5 and key resistance at $27.9. Weekly rebound from the ~$15-16 swing low pushed price to ~$22.76, reclaiming the 50-day/50-EMA cluster (~$21-22) while still below the 100/200 MAs; momentum improved (RSI ~59).
Base-building continues: price consolidates above the reclaimed $21-22 MA cluster, then grinds higher into the $27-31 zone (100MA/100EMA area) as a Wave (A)/(1) recovery leg, with a likely pullback retest before the next push.
Rebound fails at the $27-31 supply band (Fib/MA confluence), rolling over into a deeper retest of the base; risk becomes a continuation of the larger Elliott decline (bear market Wave (C)/(5) extension).
Weekly closes hold above ~$22.10 (EMA50) and then break/hold above ~$27.87 (SMA100).
Weekly close below ~$18.50 (loss of the rebound structure; risk of retesting ~$15-16).
Start near reclaimed EMA50/SMA50 support (~$21-22); add on pullback to prior breakdown area (~$18-19); heavy add only on full base retest near the swing low (~$15-16).
Trim into the first major MA supply cluster (~$31-34), then more aggressively into prior congestion/mean-reversion zones (~$38-44); close if price mean-reverts toward long-term MAs/prior support-turned-resistance (~$48-55).
As of May 22, 2026, FIVN (Five9 Inc.) is in a bottoming attempt state on the weekly chart with 63% confidence. Weekly rebound from the ~$15-16 swing low pushed price to ~$22.76, reclaiming the 50-day/50-EMA cluster (~$21-22) while still below the 100/200 MAs; momentum improved (RSI ~59).
On the weekly timeframe, FIVN has key support at $21.5 and key resistance at $27.9. The most likely scenario (bullish) targets $27.9 and $30.8, with a revert level at $22.1.
FIVN (Five9 Inc.) is currently classified as bottoming attempt on the weekly chart, with 63% confidence. Confirmation requires: Weekly closes hold above ~$22.10 (EMA50) and then break/hold above ~$27.87 (SMA100). This would be invalidated by: Weekly close below ~$18.50 (loss of the rebound structure; risk of retesting ~$15-16).
The most likely scenario (bullish) targets $27.9 and $30.8, with a revert level at $22.1. The alternative scenario (bearish) targets $18.5 and $15.5.
Multi-layer AI agents analyse 200+ stocks across daily, weekly, and monthly timeframes — producing market state classifications, price scenarios with targets, and position entry/exit levels. Daily charts updated every trading day at 6 PM ET. Weekly charts refresh Fridays. Monthly charts refresh on the last trading day of each month. No paywall. No sign-up required.
Built by Foliotrail.
All content on this website — including charts, analysis, price targets, support/resistance levels, and position zones — is generated entirely by AI and provided for educational and informational purposes only.
This is not financial advice. NEXUSNOIR VENTURES SL (the operator of this website) is not a registered investment adviser or broker-dealer. You should not make investment decisions based solely on this information. Always do your own research and consult a qualified financial advisor.
By continuing, you acknowledge that you have read and agree to our full disclaimer & terms of use and privacy policy.