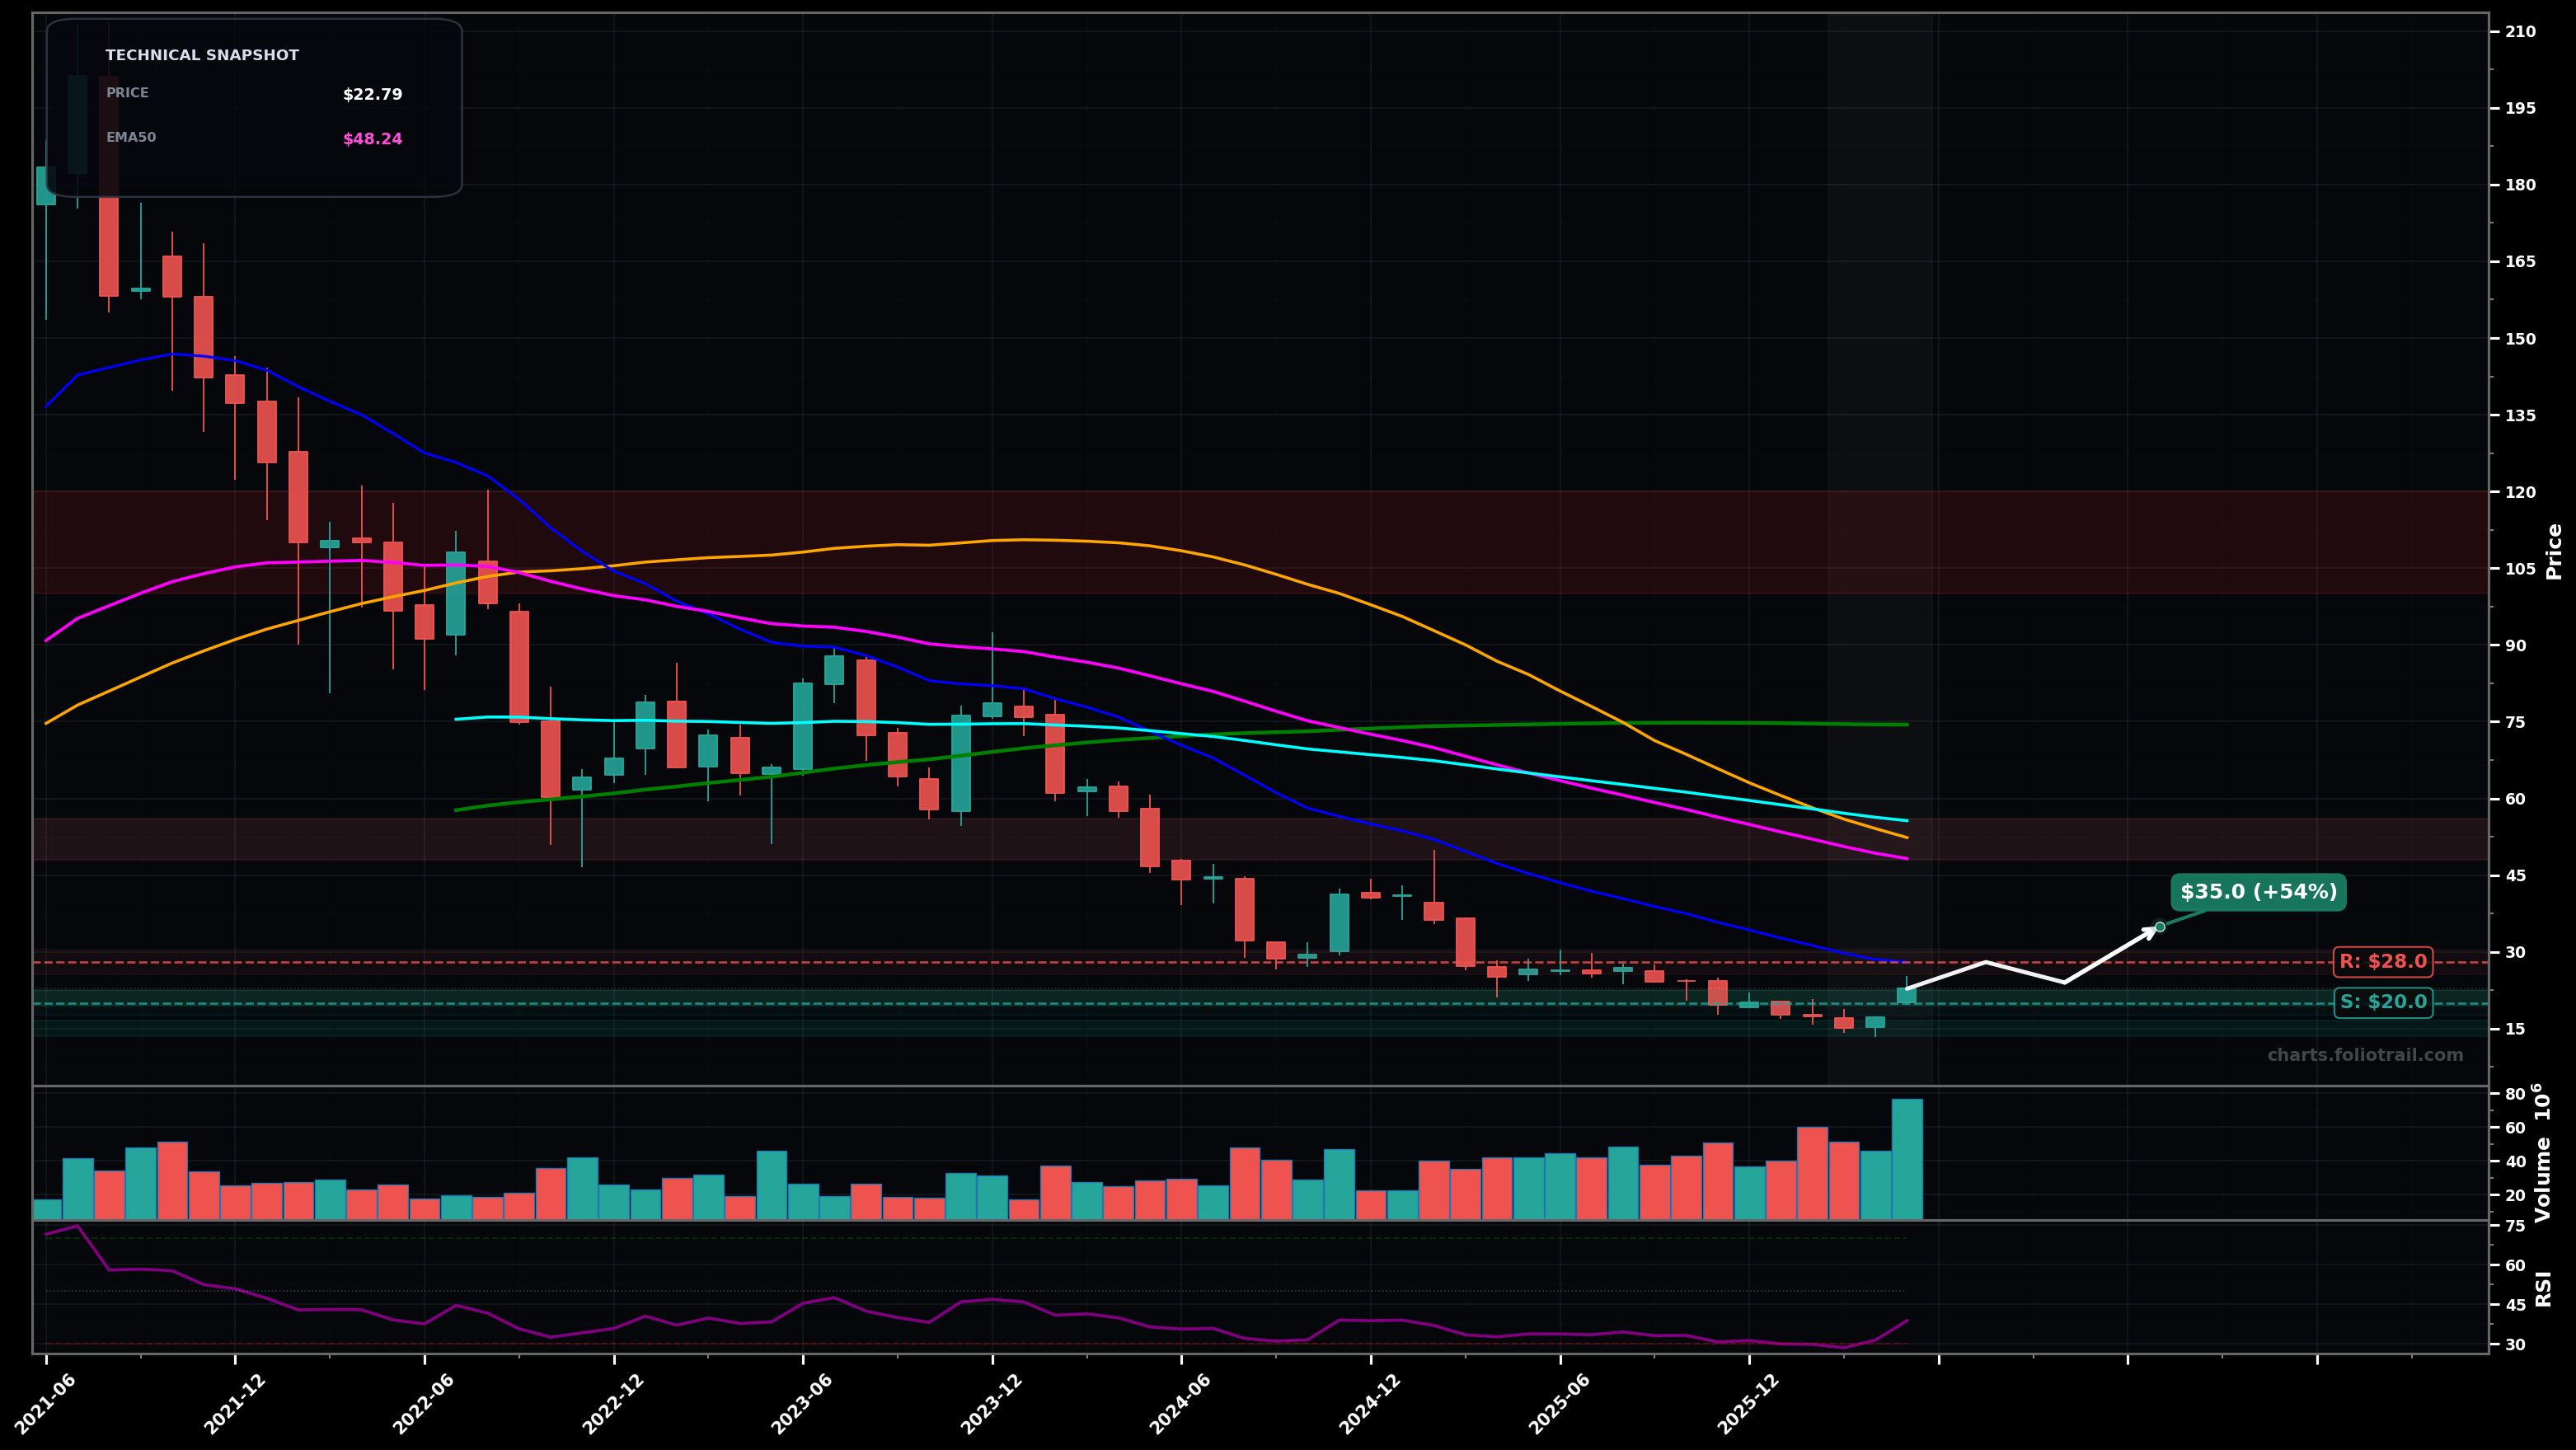
As of May 22, 2026, FIVN (Five9 Inc.) is in a downtrend state on the monthly chart, with a confidence level of 82%. Key support is at $20.0 and key resistance at $28.0. Multi-year monthly selloff continues; price at $22.79 is far below all key MAs, with a small bounce attempt off the recent lows as RSI-14 lifts to ~39.
Base-building attempt: price holds $20 support and mean-reverts upward toward the first heavy MA cluster; likely a corrective rally (Elliott Wave: wave (4) type bounce within a broader bearish sequence).
Trend continuation down: support fails and a new LL prints; this would fit an Elliott wave impulsive leg lower (wave (5) continuation) with a Fibonacci-style extension move after the breakdown.
Monthly close below $20.00 (break of the most recent swing-low zone) would confirm continued downtrend pressure
Two consecutive monthly closes back above $30.00 would start to invalidate immediate bearish control (first meaningful reclaim/HL attempt)
Start near current swing-low support ($20) for a potential base; add on breakdown/flush zones into prior demand; heavy add only if capitulation creates deep discount while monitoring for a monthly reversal/HL.
Trim into major MA resistance clusters first (EMA50/EMA100/SMA50), then into the long-term SMA100/SMA200 region, and fully exit into the prior distribution/upper range where multi-year mean reversion would likely be stretched.
As of May 22, 2026, FIVN (Five9 Inc.) is in a downtrend state on the monthly chart with 82% confidence. Multi-year monthly selloff continues; price at $22.79 is far below all key MAs, with a small bounce attempt off the recent lows as RSI-14 lifts to ~39.
On the monthly timeframe, FIVN has key support at $20.0 and key resistance at $28.0. The most likely scenario (bullish) targets $28.0 and $35.0, with a revert level at $24.0.
FIVN (Five9 Inc.) is currently classified as downtrend on the monthly chart, with 82% confidence. Confirmation requires: Monthly close below $20.00 (break of the most recent swing-low zone) would confirm continued downtrend pressure This would be invalidated by: Two consecutive monthly closes back above $30.00 would start to invalidate immediate bearish control (first meaningful reclaim/HL attempt)
The most likely scenario (bullish) targets $28.0 and $35.0, with a revert level at $24.0. The alternative scenario (bearish) targets $18.0 and $14.0.
Multi-layer AI agents analyse 200+ stocks across daily, weekly, and monthly timeframes — producing market state classifications, price scenarios with targets, and position entry/exit levels. Daily charts updated every trading day at 6 PM ET. Weekly charts refresh Fridays. Monthly charts refresh on the last trading day of each month. No paywall. No sign-up required.
Built by Foliotrail.
All content on this website — including charts, analysis, price targets, support/resistance levels, and position zones — is generated entirely by AI and provided for educational and informational purposes only.
This is not financial advice. NEXUSNOIR VENTURES SL (the operator of this website) is not a registered investment adviser or broker-dealer. You should not make investment decisions based solely on this information. Always do your own research and consult a qualified financial advisor.
By continuing, you acknowledge that you have read and agree to our full disclaimer & terms of use and privacy policy.