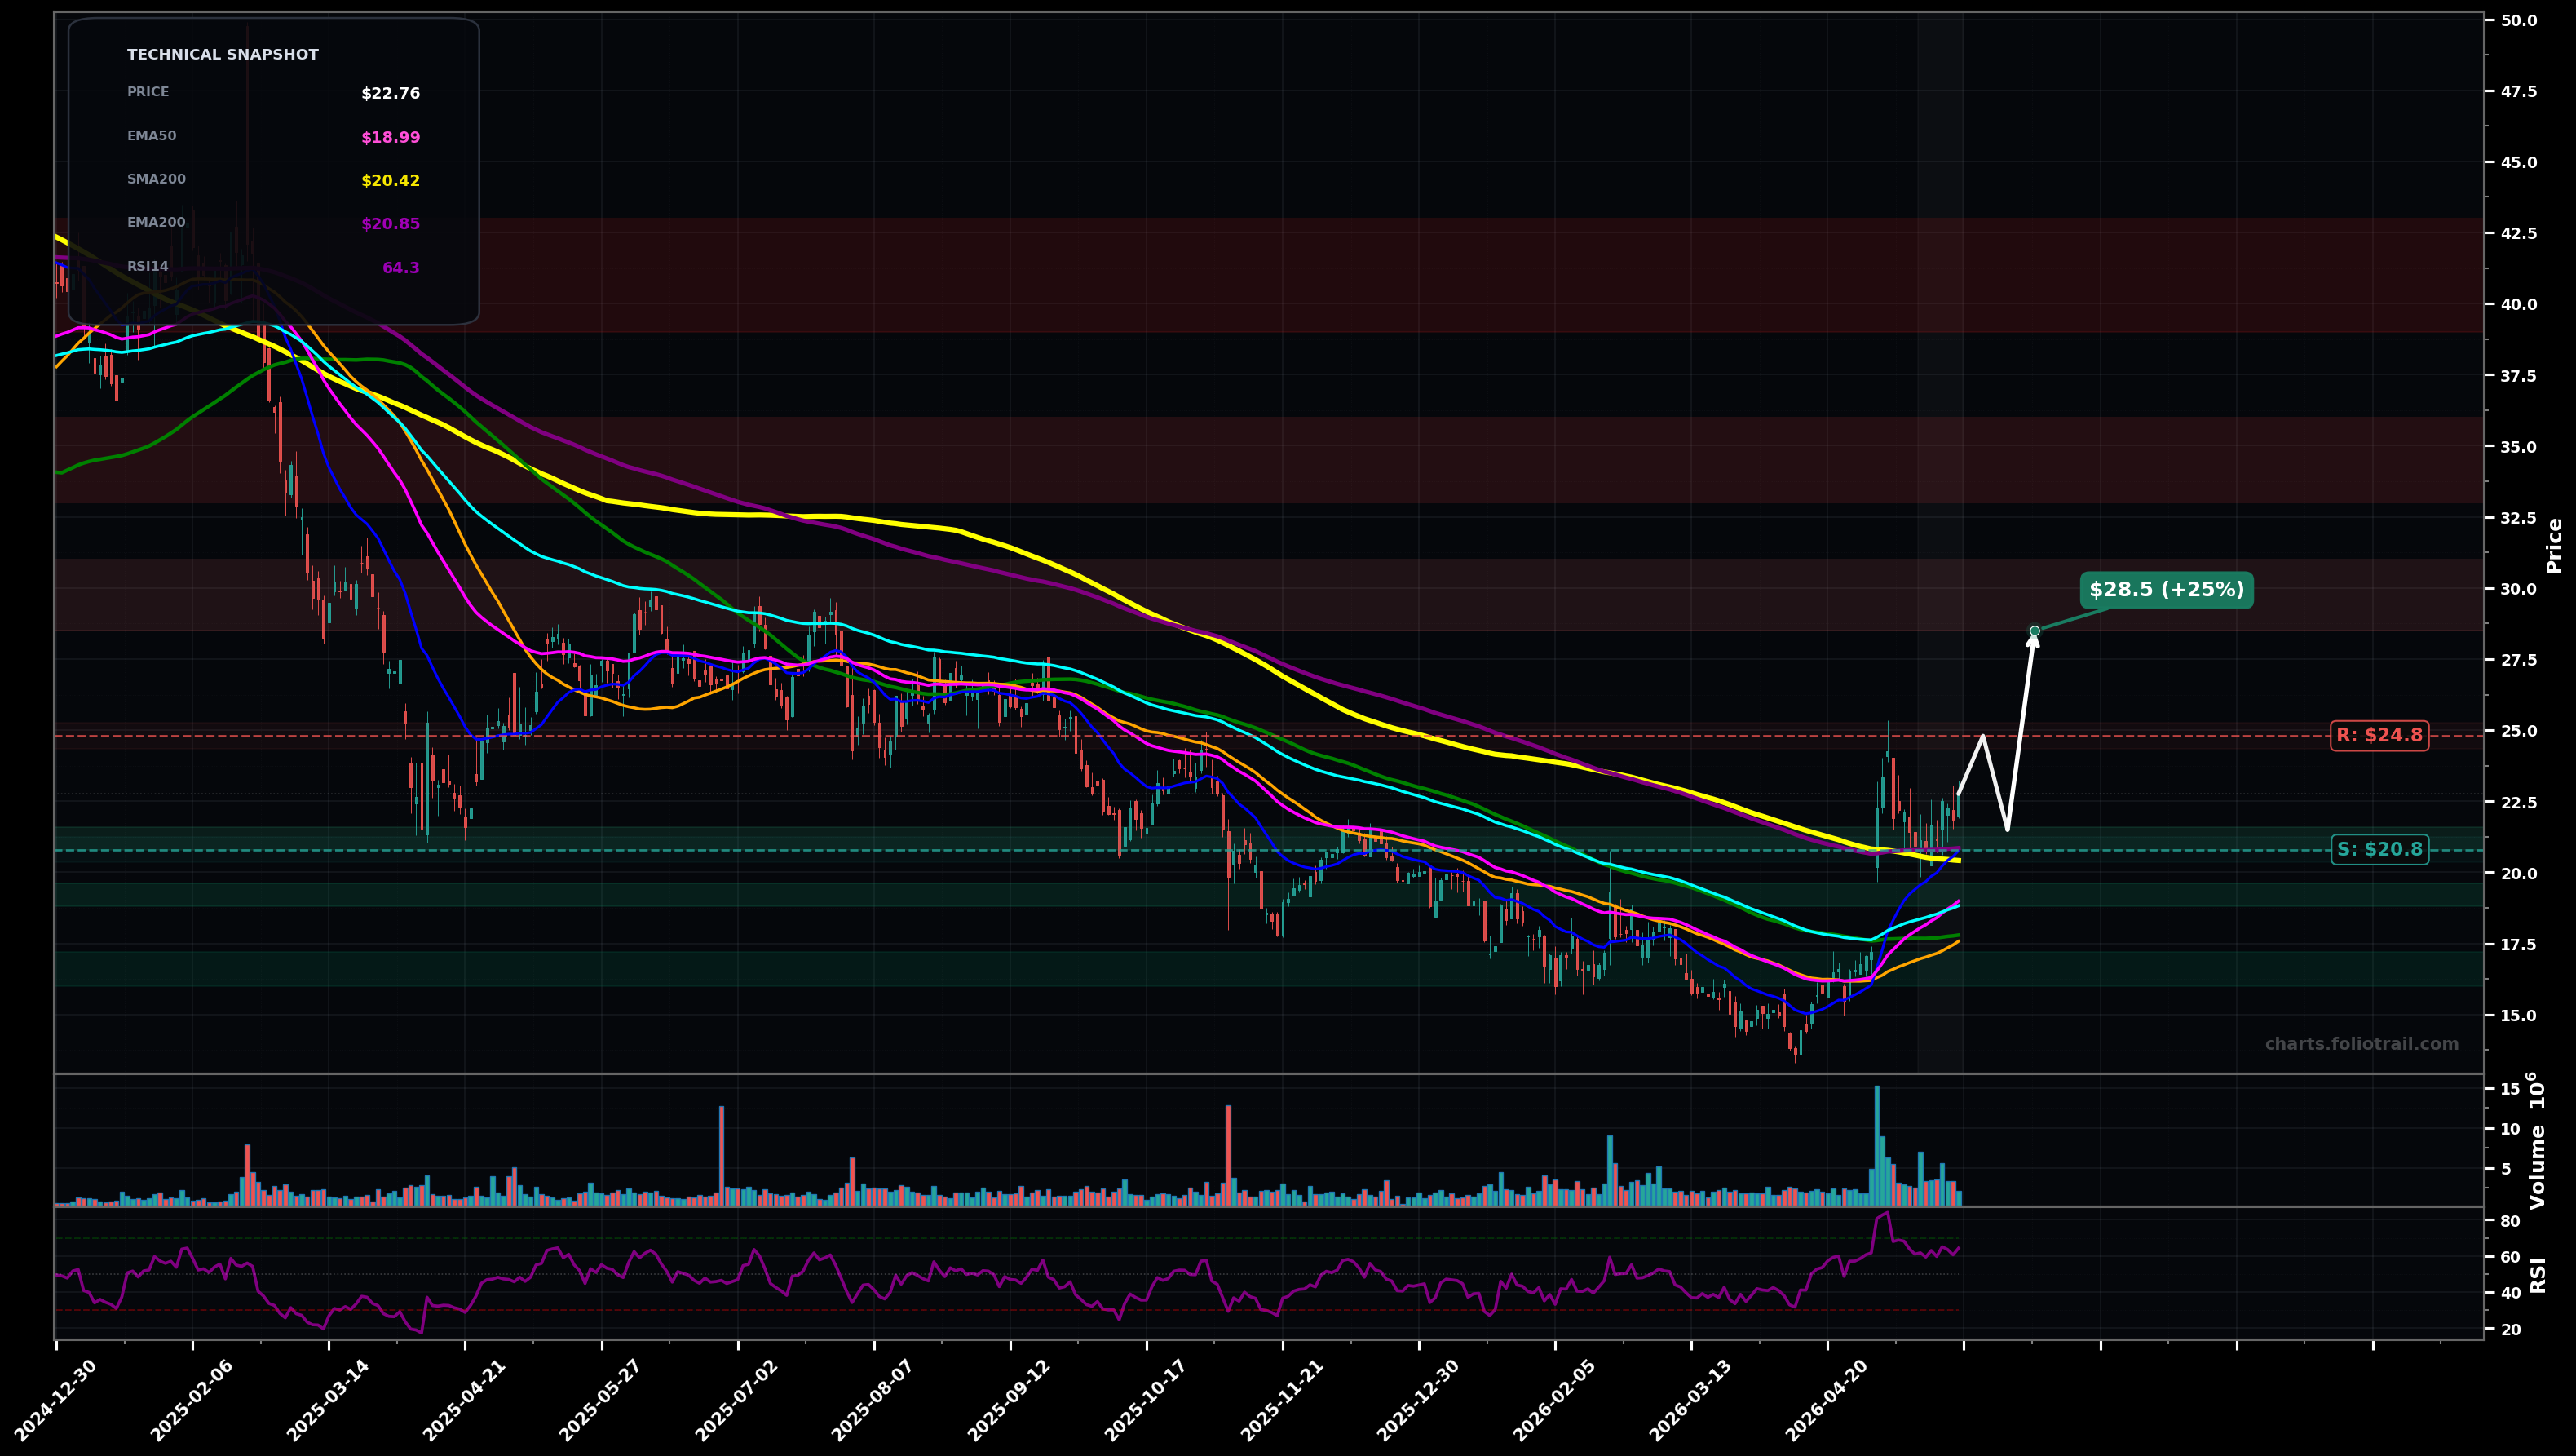
As of May 22, 2026, FIVN (Five9 Inc.) is in a bottoming attempt state on the daily chart, with a confidence level of 66%. Key support is at $20.8 and key resistance at $24.8. Sharp rebound from ~$15s with a high-volume spike; price now consolidating around $22.76 above the short/mid MAs, RSI ~64 (bullish momentum but not extreme).
Bullish continuation: consolidation resolves higher; price retests the recent spike high then works into the falling long MAs (SMA200/EMA200 region) as the next major supply zone. Rough probability 60%.
Pullback/failed breakout: rejection under $24.80 leads to a deeper mean-reversion into the reclaimed MA cluster; base still possible but momentum cools. Rough probability 40%.
Daily closes hold above $22.50 and then break/close above $24.80.
Daily close back below $18.80 (loss of EMA50/EMA100 cluster).
Start near swing support/EMA200 (~$20.85) area, add at EMA50/EMA100 reclaim zone (~$18.8-$19.0), heavy add only on deeper retrace toward prior base/near recent pivot lows in the mid-$16s.
Trim into the first major overhead supply where long MAs and prior structure likely cap (upper-$20s), more trims into the next resistance bands (low/mid-$30s), and close into prior distribution zone/major breakdown area (around $40+).
As of May 22, 2026, FIVN (Five9 Inc.) is in a bottoming attempt state on the daily chart with 66% confidence. Sharp rebound from ~$15s with a high-volume spike; price now consolidating around $22.76 above the short/mid MAs, RSI ~64 (bullish momentum but not extreme).
On the daily timeframe, FIVN has key support at $20.8 and key resistance at $24.8. The most likely scenario (bullish) targets $24.8 and $28.5, with a revert level at $21.5.
FIVN (Five9 Inc.) is currently classified as bottoming attempt on the daily chart, with 66% confidence. Confirmation requires: Daily closes hold above $22.50 and then break/close above $24.80. This would be invalidated by: Daily close back below $18.80 (loss of EMA50/EMA100 cluster).
The most likely scenario (bullish) targets $24.8 and $28.5, with a revert level at $21.5. The alternative scenario (bearish) targets $20.8 and $18.8.
Multi-layer AI agents analyse 200+ stocks across daily, weekly, and monthly timeframes — producing market state classifications, price scenarios with targets, and position entry/exit levels. Daily charts updated every trading day at 6 PM ET. Weekly charts refresh Fridays. Monthly charts refresh on the last trading day of each month. No paywall. No sign-up required.
Built by Foliotrail.
All content on this website — including charts, analysis, price targets, support/resistance levels, and position zones — is generated entirely by AI and provided for educational and informational purposes only.
This is not financial advice. NEXUSNOIR VENTURES SL (the operator of this website) is not a registered investment adviser or broker-dealer. You should not make investment decisions based solely on this information. Always do your own research and consult a qualified financial advisor.
By continuing, you acknowledge that you have read and agree to our full disclaimer & terms of use and privacy policy.