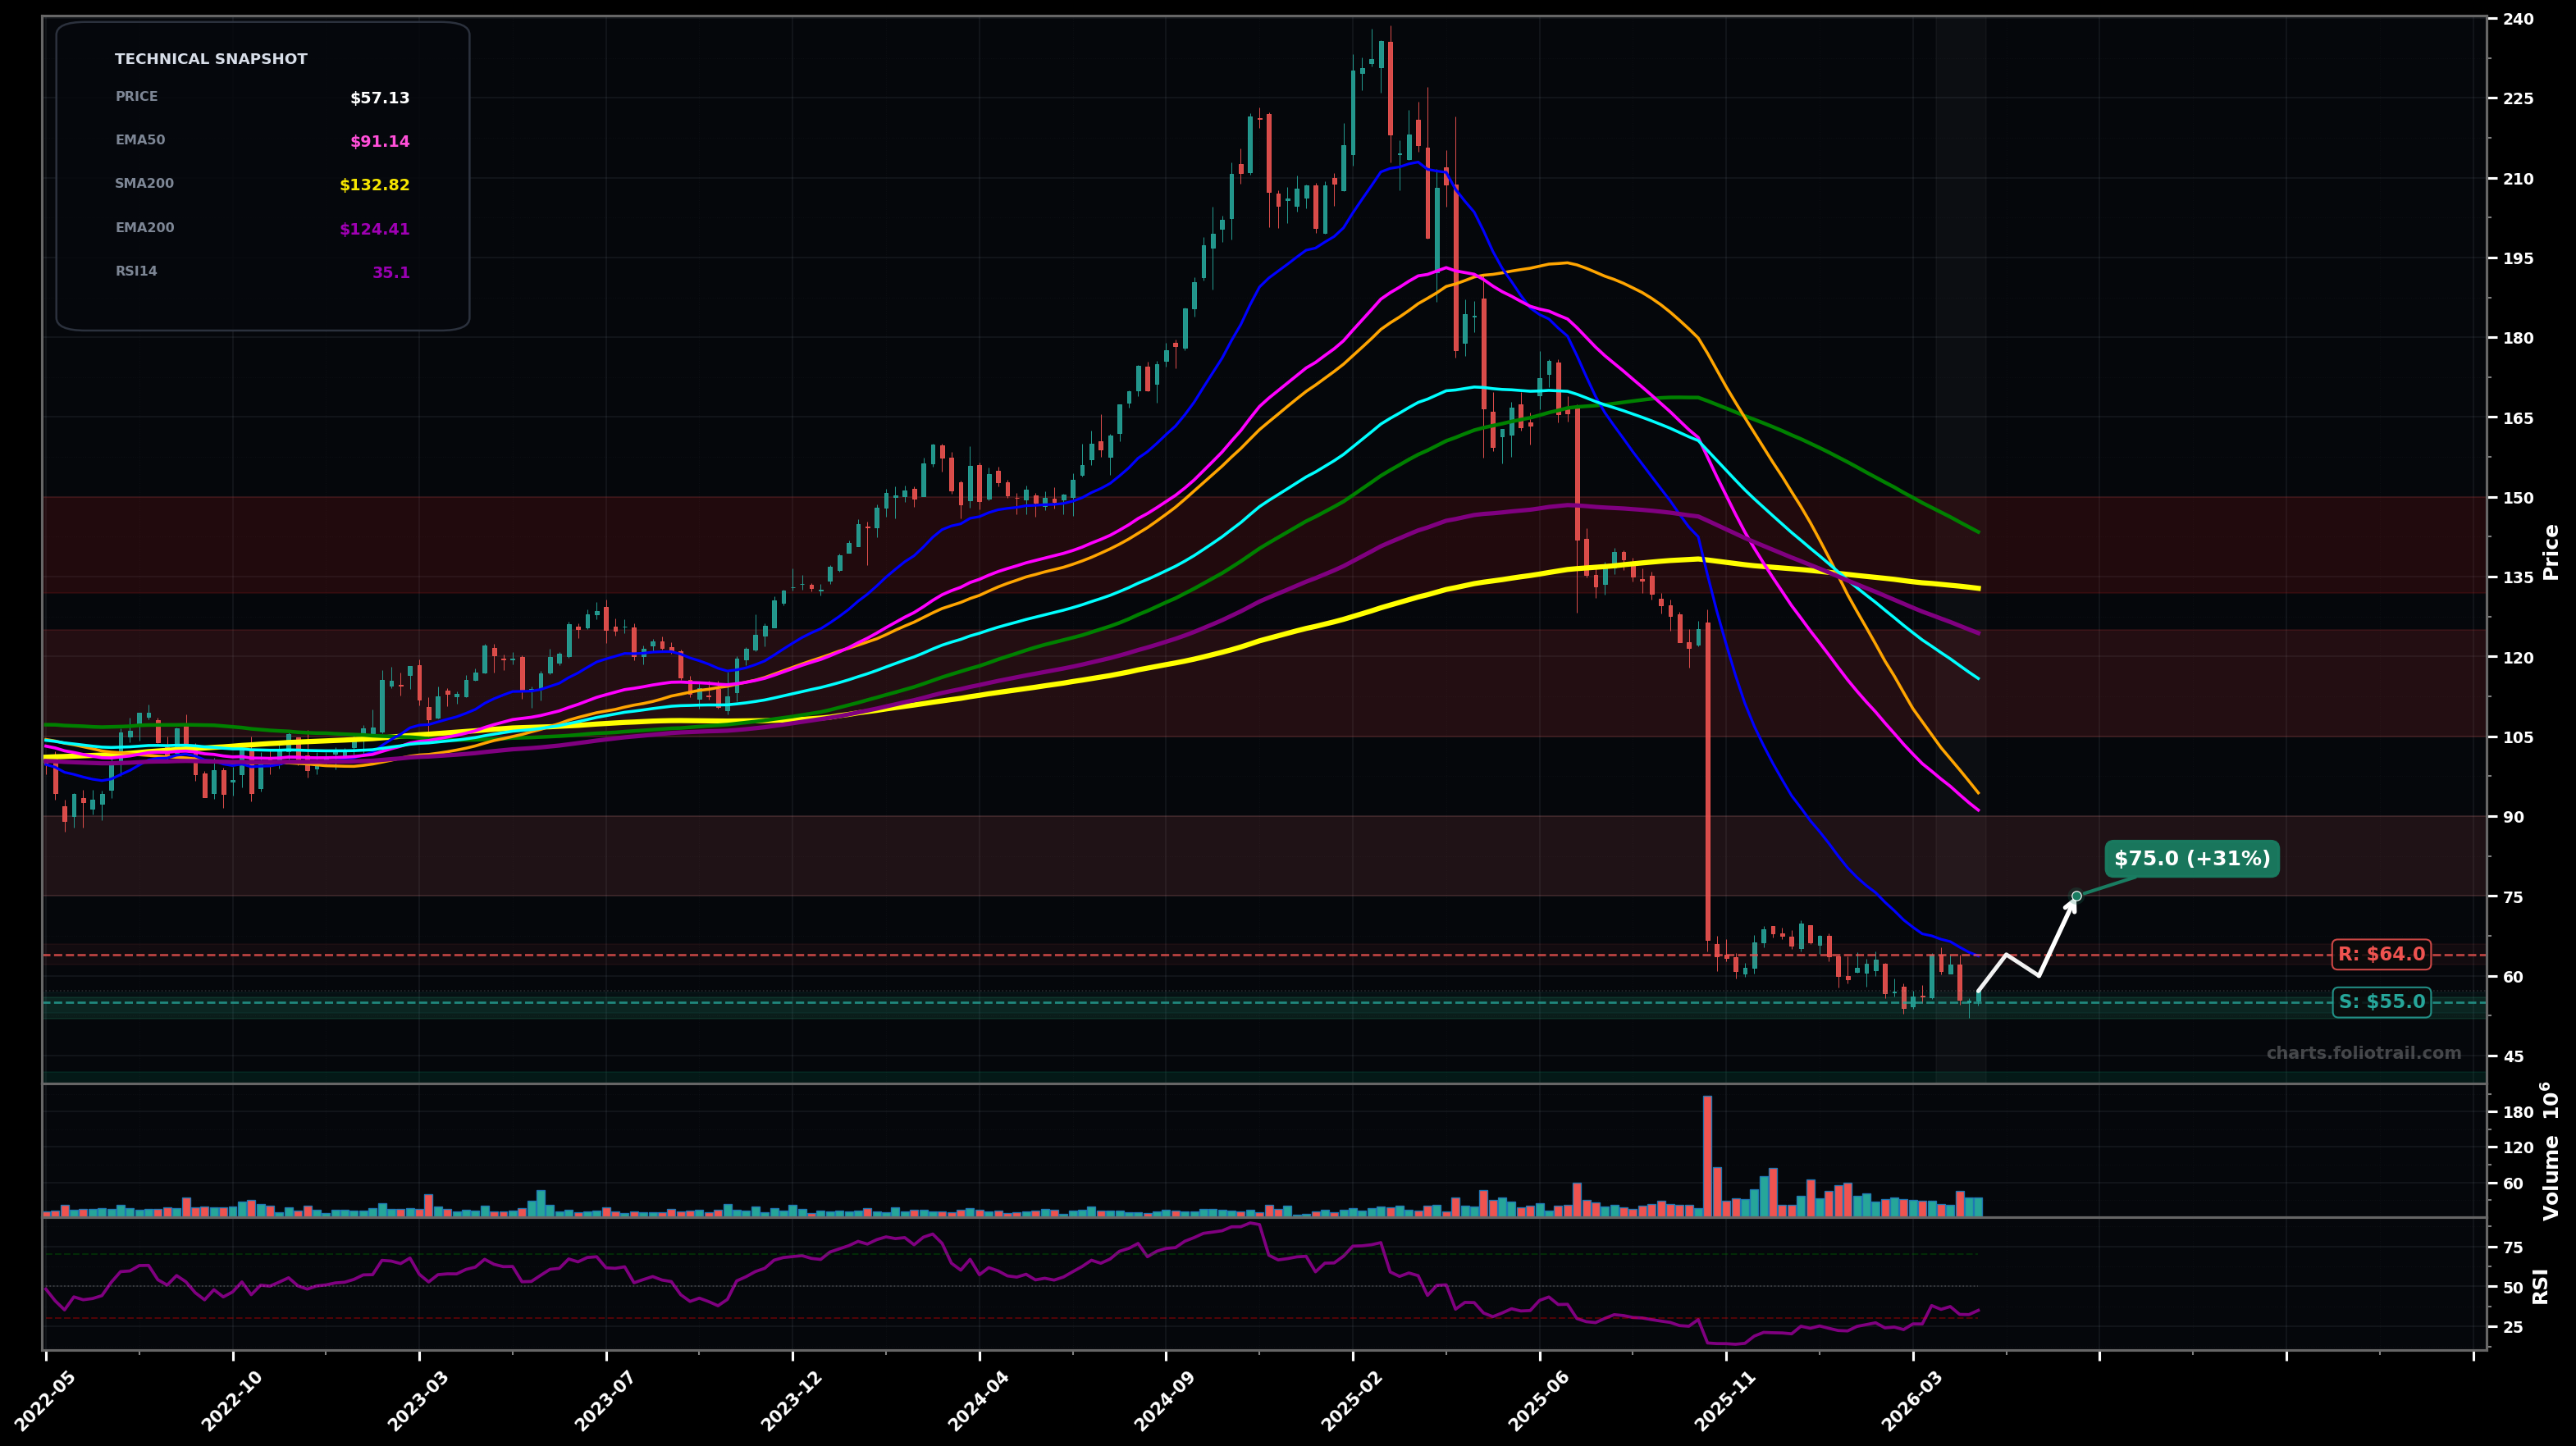
As of May 22, 2026, FISV (Fiserv, Inc.) is in a falling knife state on the weekly chart, with a confidence level of 78%. Key support is at $55.0 and key resistance at $64.0. After a major gap-down selloff from the $130s, price is basing tightly around $55–$62 with RSI ~35 and still well below all key EMAs/SMAs.
Base-building continues: price holds $55 support and grinds up toward the post-crash supply zone; likely a corrective bounce (Elliott: wave 4 / ABC relief) into Fib retracement resistance before sellers reappear.
Support fails: another leg down (Elliott: wave 5 continuation) as the weak base breaks; measured move aims for next psychological/extension zone.
FALLING_KNIFE confirmed on a weekly close below $55.00
Invalidated on two weekly closes above $64.00 (reclaim/hold above recent base ceiling)
Entries staged around current swing-low support ($55) and lower downside targets if $55 breaks; trend is still bearish so size increases only at deeper discount/extension levels.
Trim into likely Fib/MA supply zones: first into the $75–$90 retracement area, more into $105–$125 near EMA100/EMA200 region, and fully exit near $132–$150 where prior breakdown and long MAs/overhead supply likely cap multi-year upside.
As of May 22, 2026, FISV (Fiserv, Inc.) is in a falling knife state on the weekly chart with 78% confidence. After a major gap-down selloff from the $130s, price is basing tightly around $55–$62 with RSI ~35 and still well below all key EMAs/SMAs.
On the weekly timeframe, FISV has key support at $55.0 and key resistance at $64.0. The most likely scenario (bullish) targets $64.0 and $75.0, with a revert level at $60.0.
FISV (Fiserv, Inc.) is currently classified as falling knife on the weekly chart, with 78% confidence. Confirmation requires: FALLING_KNIFE confirmed on a weekly close below $55.00 This would be invalidated by: Invalidated on two weekly closes above $64.00 (reclaim/hold above recent base ceiling)
The most likely scenario (bullish) targets $64.0 and $75.0, with a revert level at $60.0. The alternative scenario (bearish) targets $50.0 and $42.0.
Multi-layer AI agents analyse 200+ stocks across daily, weekly, and monthly timeframes — producing market state classifications, price scenarios with targets, and position entry/exit levels. Daily charts updated every trading day at 6 PM ET. Weekly charts refresh Fridays. Monthly charts refresh on the last trading day of each month. No paywall. No sign-up required.
Built by Foliotrail.
All content on this website — including charts, analysis, price targets, support/resistance levels, and position zones — is generated entirely by AI and provided for educational and informational purposes only.
This is not financial advice. NEXUSNOIR VENTURES SL (the operator of this website) is not a registered investment adviser or broker-dealer. You should not make investment decisions based solely on this information. Always do your own research and consult a qualified financial advisor.
By continuing, you acknowledge that you have read and agree to our full disclaimer & terms of use and privacy policy.