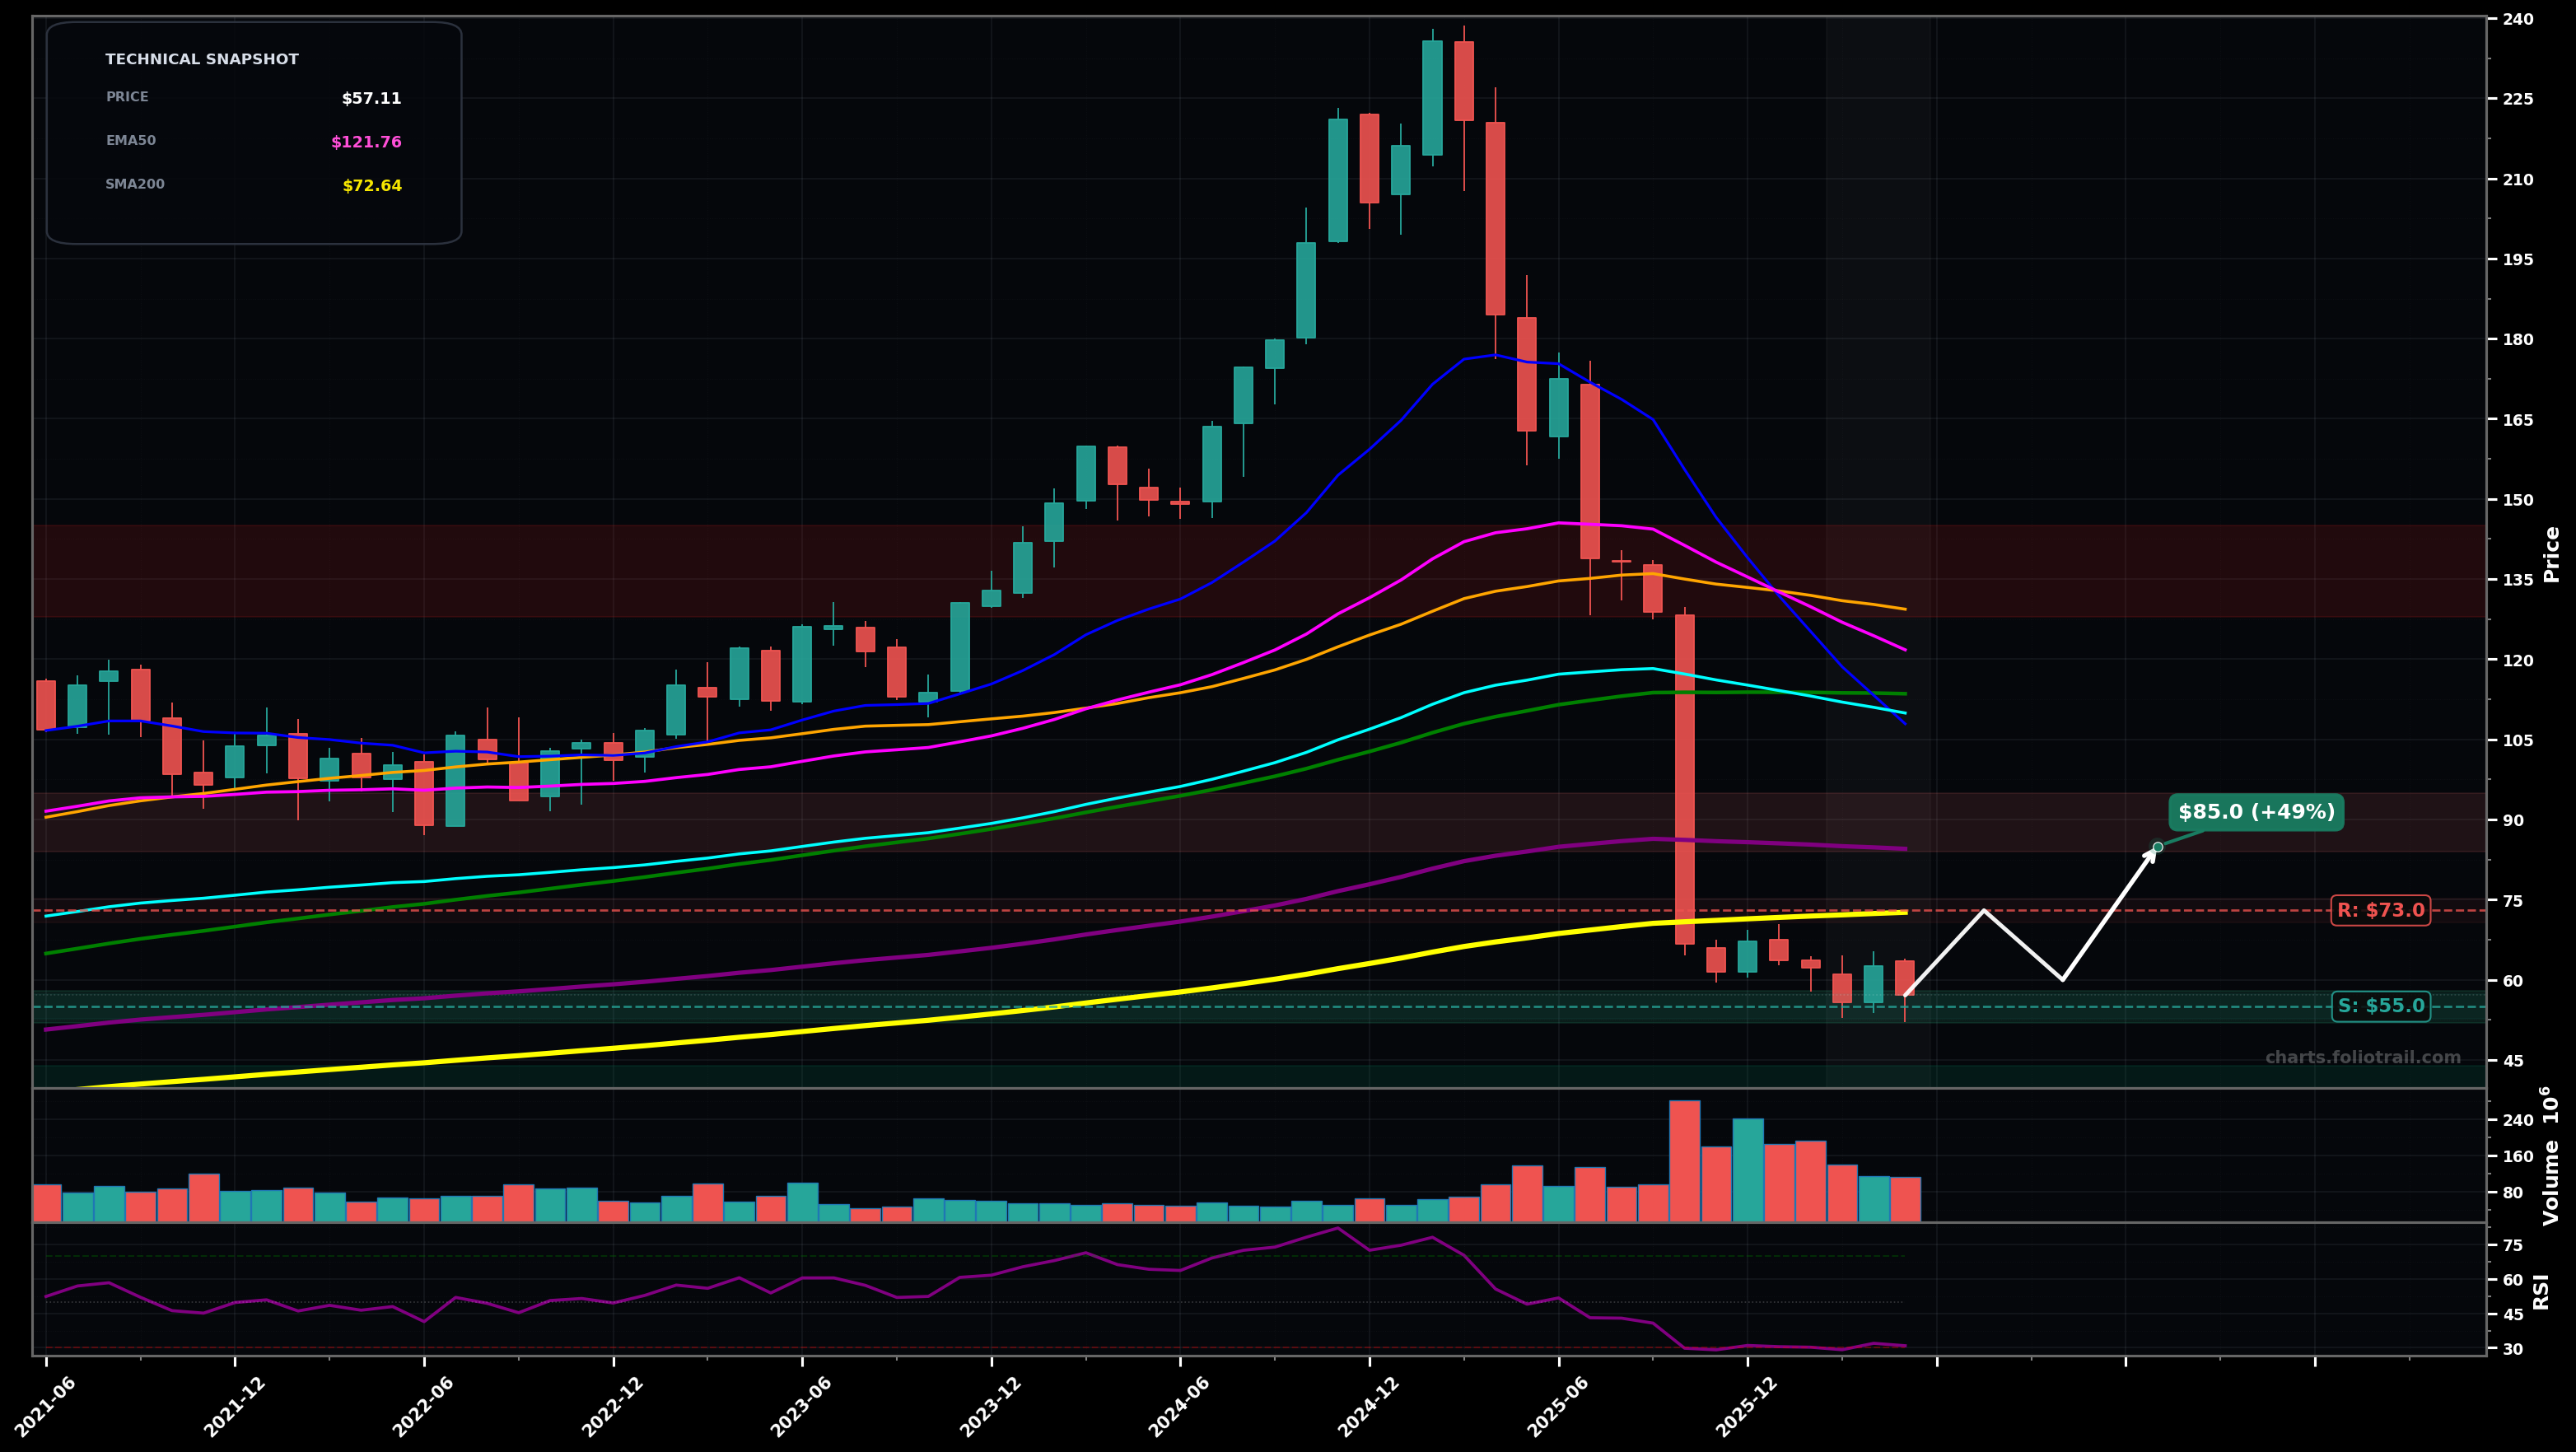
As of May 22, 2026, FISV (Fiserv, Inc.) is in a falling knife state on the monthly chart, with a confidence level of 73%. Key support is at $55.0 and key resistance at $73.0. After a sharp breakdown from the $130–$110 MA cluster, price is consolidating near lows around $57 with RSI-14 ~31 (weak momentum) and all key MAs overhead.
Base-building attempt: hold $55–$60, form a higher low on monthly, then mean-revert toward the first heavy overhead supply at SMA200/EMA200 area before stalling.
Continuation leg down: lose $55 on a strong red monthly close, triggering another liquidation wave toward a fib-like extension/old demand zone, then a reflex bounce.
Monthly close below $55 would confirm continued falling-knife continuation
Monthly close back above $72 would weaken/invalidate falling-knife conditions (reclaiming key broken level/SMA200 zone)
Staggered entries around current base risk ($55), then lower-demand zones if the knife continues; avoid sizing up until a monthly HL or reclaim develops.
Trim into major overhead MA supply: first at EMA200/SMA200 region (~$85), then EMA100/EMA50 (~$110–$122), with full exit into the prior breakdown shelf (~$130–$145).
As of May 22, 2026, FISV (Fiserv, Inc.) is in a falling knife state on the monthly chart with 73% confidence. After a sharp breakdown from the $130–$110 MA cluster, price is consolidating near lows around $57 with RSI-14 ~31 (weak momentum) and all key MAs overhead.
On the monthly timeframe, FISV has key support at $55.0 and key resistance at $73.0. The most likely scenario (bullish) targets $73.0 and $85.0, with a revert level at $60.0.
FISV (Fiserv, Inc.) is currently classified as falling knife on the monthly chart, with 73% confidence. Confirmation requires: Monthly close below $55 would confirm continued falling-knife continuation This would be invalidated by: Monthly close back above $72 would weaken/invalidate falling-knife conditions (reclaiming key broken level/SMA200 zone)
The most likely scenario (bullish) targets $73.0 and $85.0, with a revert level at $60.0. The alternative scenario (bearish) targets $50.0 and $42.0.
Multi-layer AI agents analyse 200+ stocks across daily, weekly, and monthly timeframes — producing market state classifications, price scenarios with targets, and position entry/exit levels. Daily charts updated every trading day at 6 PM ET. Weekly charts refresh Fridays. Monthly charts refresh on the last trading day of each month. No paywall. No sign-up required.
Built by Foliotrail.
All content on this website — including charts, analysis, price targets, support/resistance levels, and position zones — is generated entirely by AI and provided for educational and informational purposes only.
This is not financial advice. NEXUSNOIR VENTURES SL (the operator of this website) is not a registered investment adviser or broker-dealer. You should not make investment decisions based solely on this information. Always do your own research and consult a qualified financial advisor.
By continuing, you acknowledge that you have read and agree to our full disclaimer & terms of use and privacy policy.