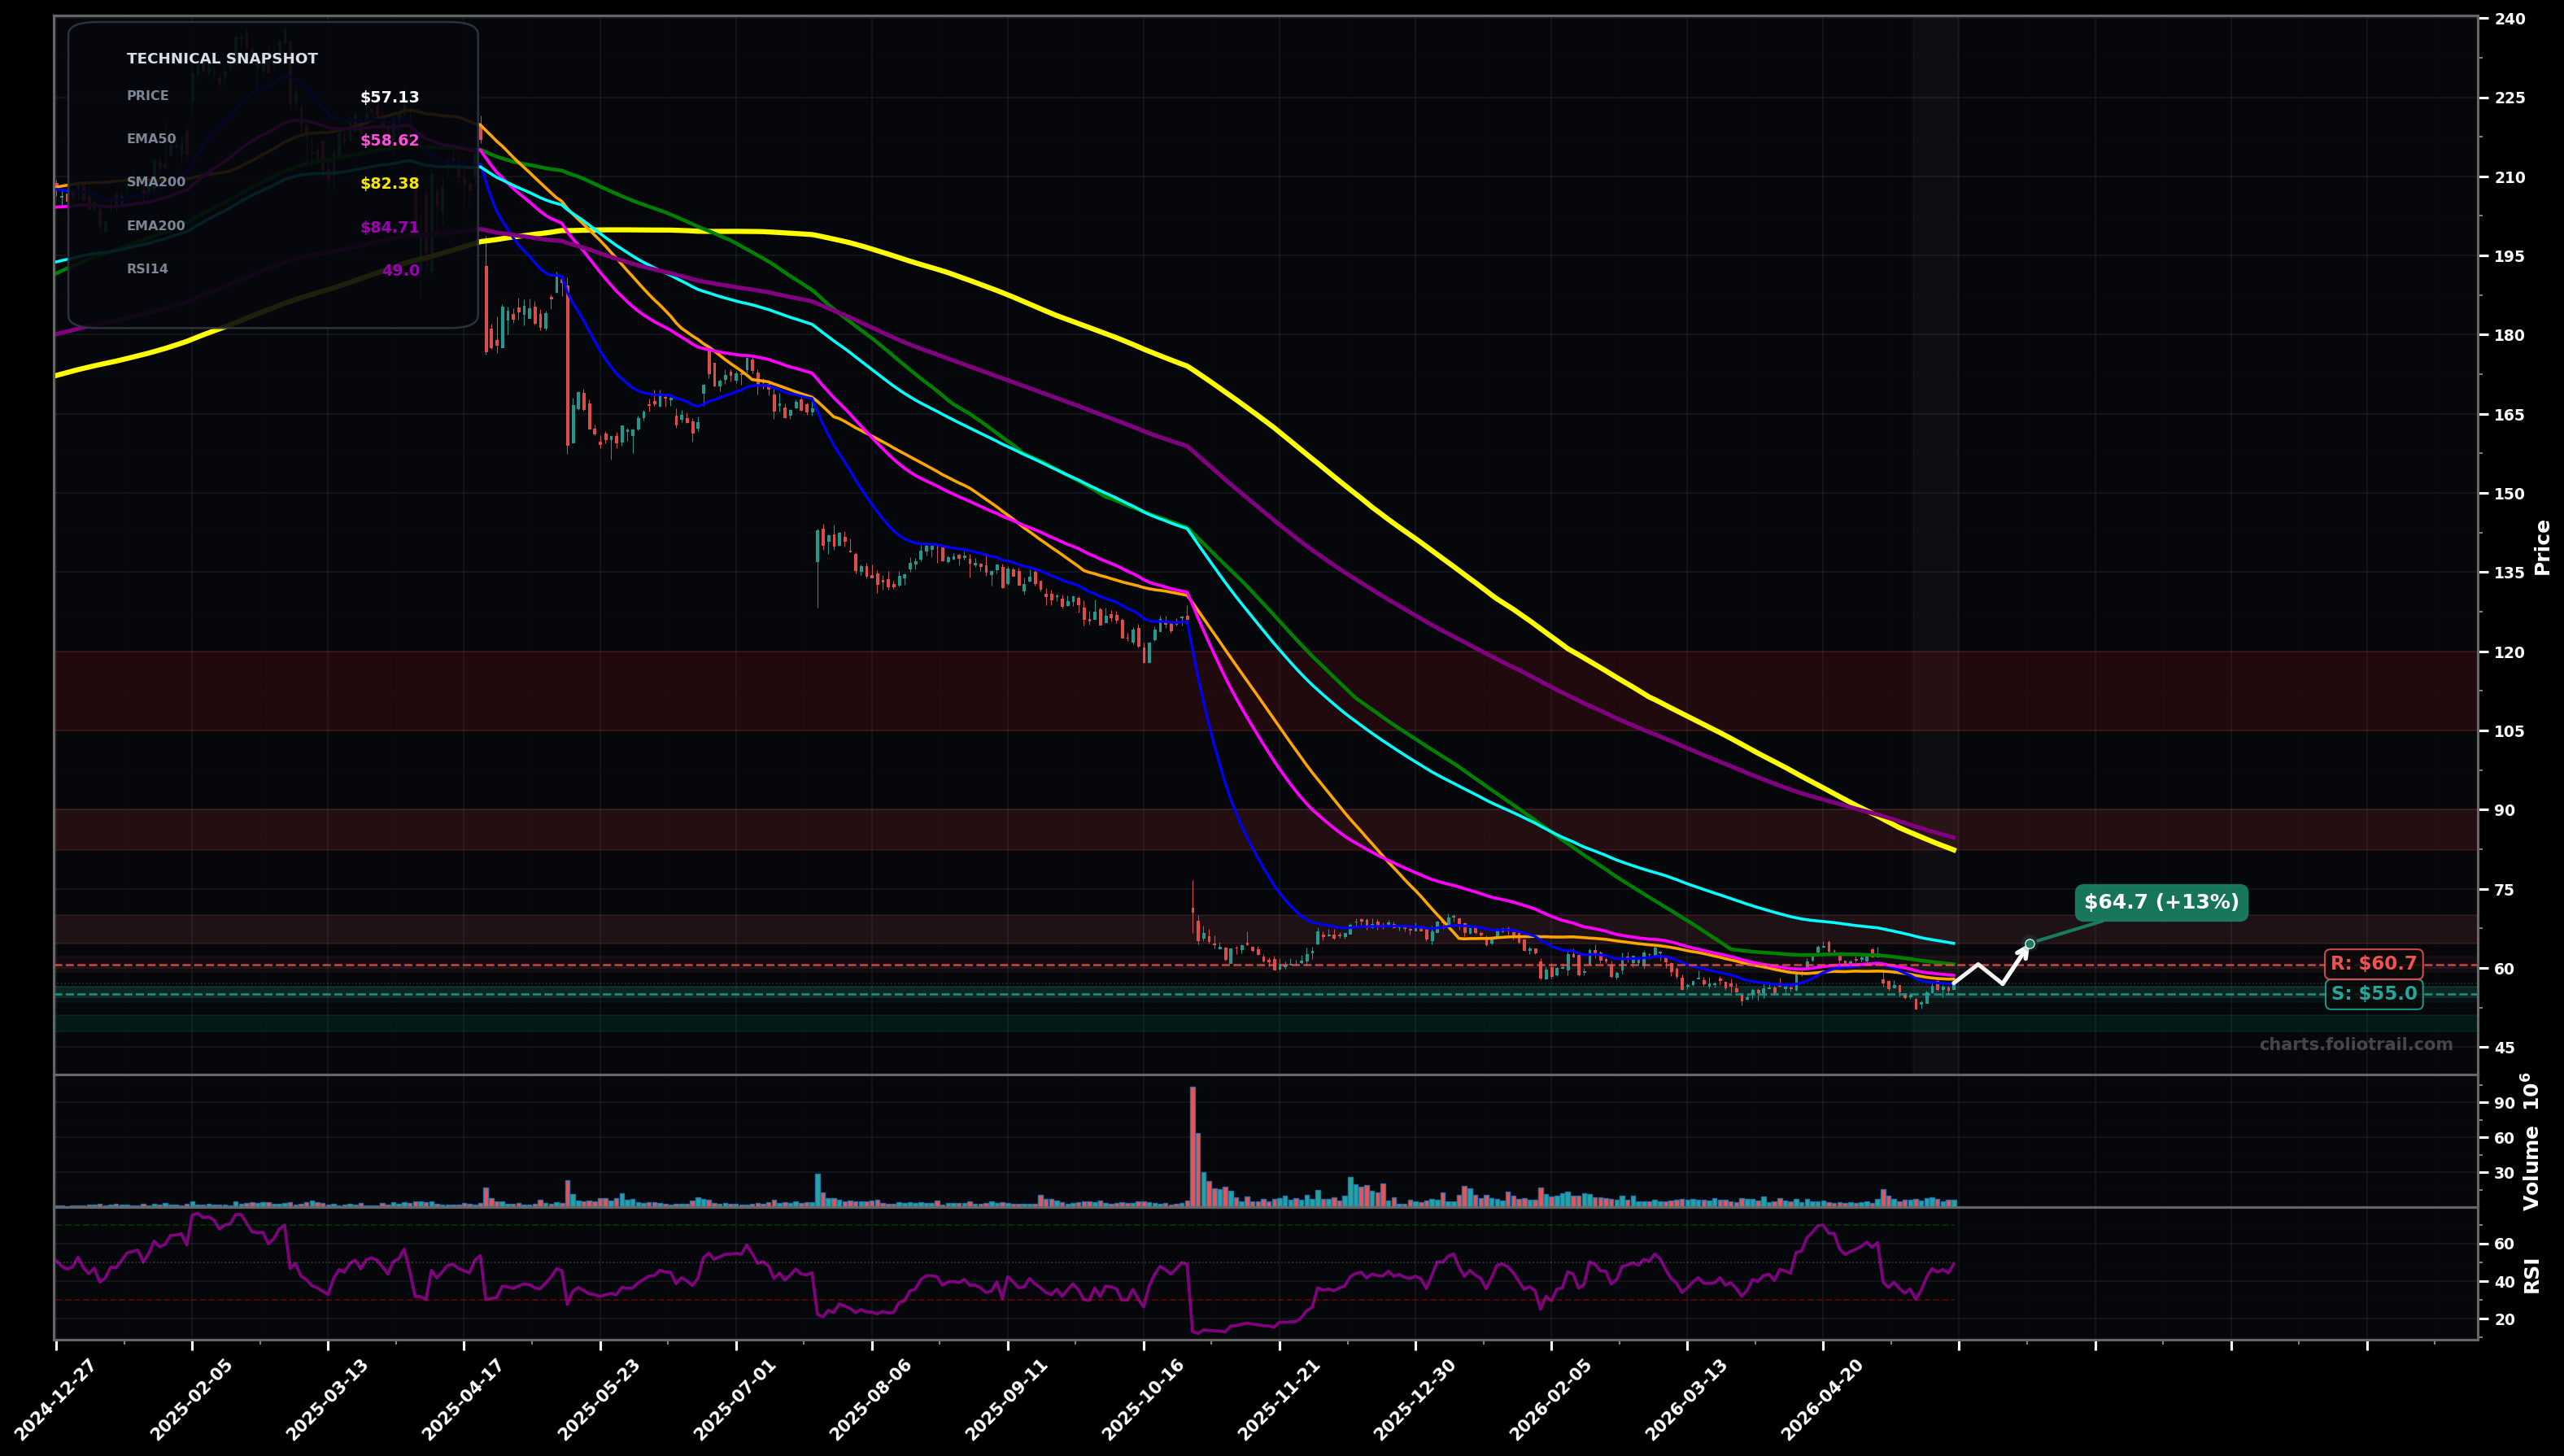
As of May 22, 2026, FISV (Fiserv, Inc.) is in a bottoming attempt state on the daily chart, with a confidence level of 62%. Key support is at $55.0 and key resistance at $60.7. Price is basing near $57 with small overlapping candles after a long multi-month decline; still below all key EMAs/SMAs.
Base continues and a slow breakout attempt develops: reclaim EMA50 then grind toward the next MA cluster; Elliott Wave view: likely early Wave (1) up off the lows or a B-wave within a larger corrective structure; Fib focus: first upside reactions typically fade near the 38.2% retrace of the last swing-down and MA congestion.
Bearish continuation: failure at the $60-$61 supply zone leads to rollover and a retest/undercut of the base; Elliott Wave view: another leg down (Wave 5 extension or C-wave) if support breaks; Fib focus: breakdown often seeks the prior pivot-low and can overshoot to a 1.272 extension area.
2+ daily closes above $58.62 (EMA50) and then a hold above $57.00 (EMA20) on any retest
Daily close below $55.00 (break of the current base support)
Scale-in around the base support ($55) first; add on a deeper retest/undercut toward prior panic area; heavy add only if price flushes into the psychological $50 region (high-risk but best reward if the base holds).
Trim into MA/structure resistance first (EMA100 area), trim more near the long-term SMA200 zone (major supply), and fully close if it mean-reverts far above long-term trend where upside becomes asymmetrically limited.
As of May 22, 2026, FISV (Fiserv, Inc.) is in a bottoming attempt state on the daily chart with 62% confidence. Price is basing near $57 with small overlapping candles after a long multi-month decline; still below all key EMAs/SMAs.
On the daily timeframe, FISV has key support at $55.0 and key resistance at $60.7. The most likely scenario (bullish) targets $60.7 and $64.7, with a revert level at $57.0.
FISV (Fiserv, Inc.) is currently classified as bottoming attempt on the daily chart, with 62% confidence. Confirmation requires: 2+ daily closes above $58.62 (EMA50) and then a hold above $57.00 (EMA20) on any retest This would be invalidated by: Daily close below $55.00 (break of the current base support)
The most likely scenario (bullish) targets $60.7 and $64.7, with a revert level at $57.0. The alternative scenario (bearish) targets $55.0 and $50.0.
Multi-layer AI agents analyse 200+ stocks across daily, weekly, and monthly timeframes — producing market state classifications, price scenarios with targets, and position entry/exit levels. Daily charts updated every trading day at 6 PM ET. Weekly charts refresh Fridays. Monthly charts refresh on the last trading day of each month. No paywall. No sign-up required.
Built by Foliotrail.
All content on this website — including charts, analysis, price targets, support/resistance levels, and position zones — is generated entirely by AI and provided for educational and informational purposes only.
This is not financial advice. NEXUSNOIR VENTURES SL (the operator of this website) is not a registered investment adviser or broker-dealer. You should not make investment decisions based solely on this information. Always do your own research and consult a qualified financial advisor.
By continuing, you acknowledge that you have read and agree to our full disclaimer & terms of use and privacy policy.