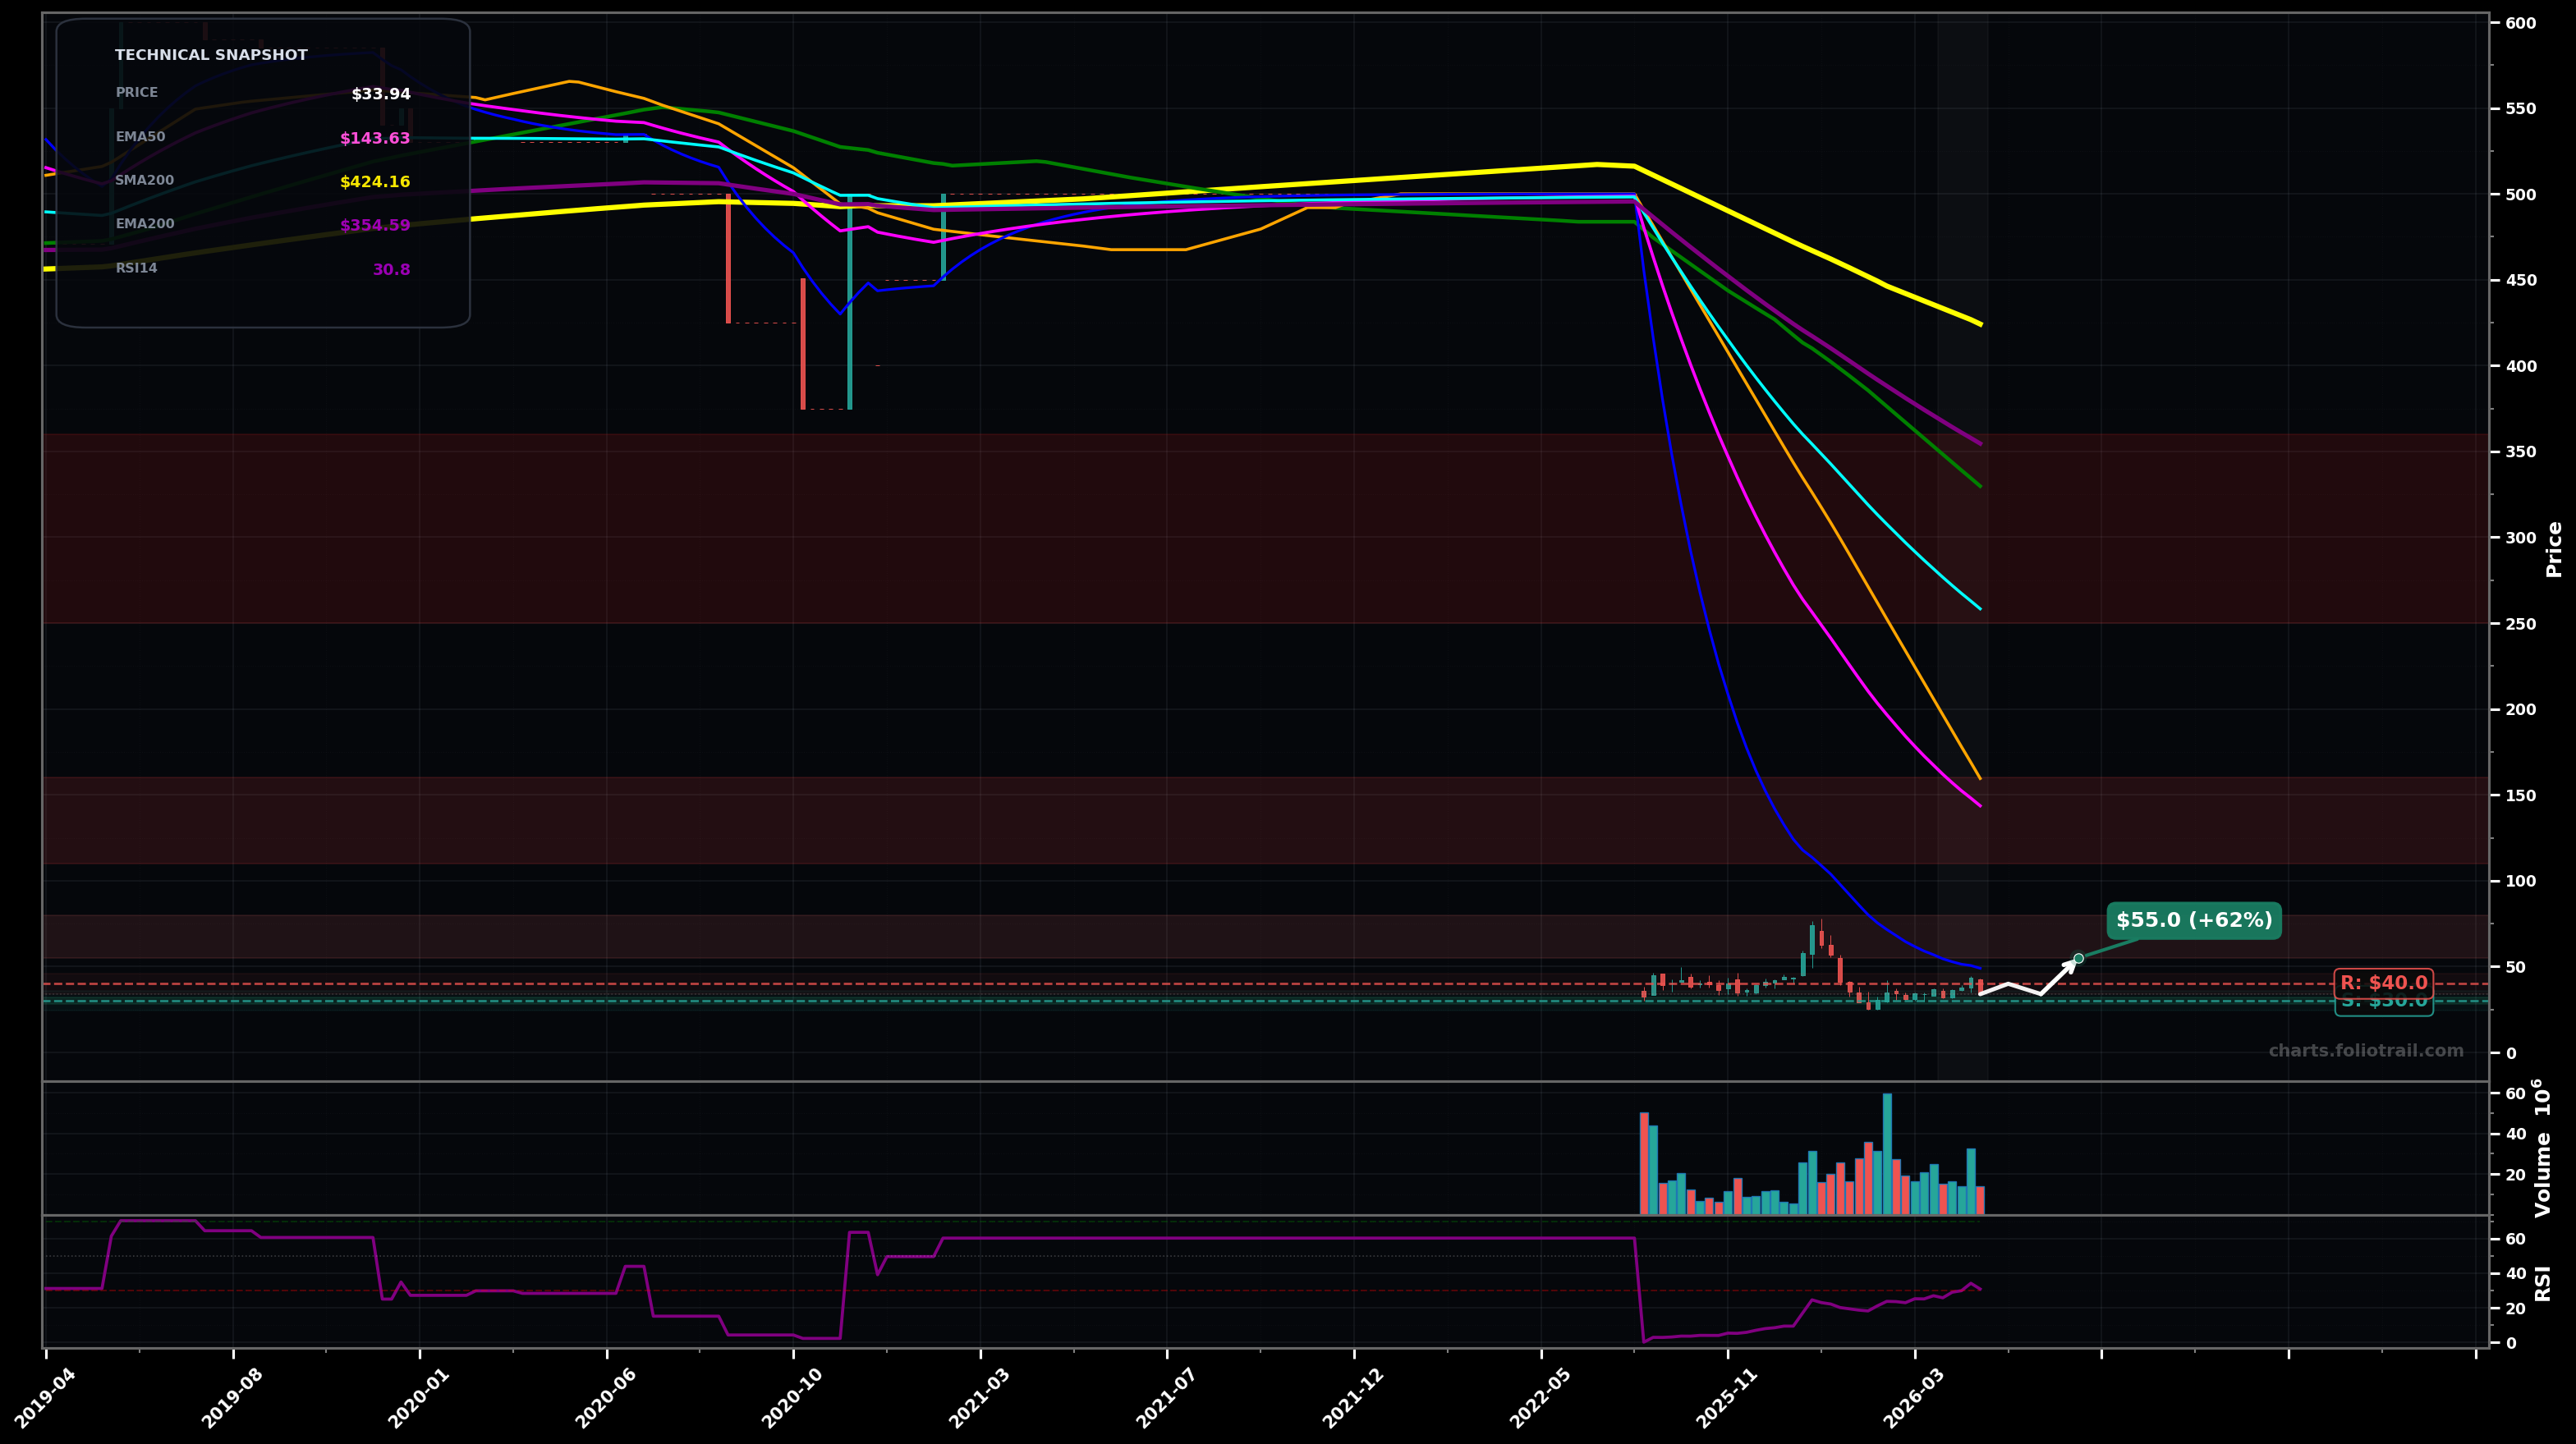
As of May 22, 2026, FIGR (Figure Technology Solutions Inc Cl A) is in a falling knife state on the weekly chart, with a confidence level of 78%. Key support is at $30.0 and key resistance at $40.0. Weekly price at ~$33.94 is consolidating after a sharp multi-month selloff; RSI-14 ~30.8 (weak momentum) and price is far below all key MAs (EMA50 ~$143.63, EMA100 ~$258.35, EMA200 ~$354.59; SMA50 ~$159.55, SMA100 ~$329.77, SMA200 ~$424.16).
Base-building attempt: hold the ~$30 swing-low area, grind sideways/up, then test the first overhead supply zone near the prior breakdown/reaction highs; still a counter-trend move until major MA reclaims.
Continuation leg down: lose ~$30 support on a decisive weekly close, triggering another liquidation wave toward the next round-number/air-pocket zone.
State remains confirmed while weekly closes stay below ~$40 (no structural reclaim / no HL).
Invalidated if FIGR prints a higher low and reclaims EMA50 with 2+ weekly closes above ~$145.
Start near the most recent swing-low support (~$30); add on breakdown-and-stabilize near next demand zones; heavy add only if capitulation/undercut occurs into deeper support while RSI remains washed-out.
Trim into the first major supply tests (prior reaction zone), then into EMA50/SMA50 region where bear-market rallies often stall, and close into the EMA200-area where long-term mean reversion would likely be very stretched.
As of May 22, 2026, FIGR (Figure Technology Solutions Inc Cl A) is in a falling knife state on the weekly chart with 78% confidence. Weekly price at ~$33.94 is consolidating after a sharp multi-month selloff; RSI-14 ~30.8 (weak momentum) and price is far below all key MAs (EMA50 ~$143.63, EMA100 ~$258.35, EMA200 ~$354.59; SMA50 ~$159.55, SMA100 ~$329.77, SMA200 ~$424.16).
On the weekly timeframe, FIGR has key support at $30.0 and key resistance at $40.0. The most likely scenario (bullish) targets $40.0 and $55.0, with a revert level at $34.0.
FIGR (Figure Technology Solutions Inc Cl A) is currently classified as falling knife on the weekly chart, with 78% confidence. Confirmation requires: State remains confirmed while weekly closes stay below ~$40 (no structural reclaim / no HL). This would be invalidated by: Invalidated if FIGR prints a higher low and reclaims EMA50 with 2+ weekly closes above ~$145.
The most likely scenario (bullish) targets $40.0 and $55.0, with a revert level at $34.0. The alternative scenario (bearish) targets $25.0 and $18.0.
Multi-layer AI agents analyse 200+ stocks across daily, weekly, and monthly timeframes — producing market state classifications, price scenarios with targets, and position entry/exit levels. Daily charts updated every trading day at 6 PM ET. Weekly charts refresh Fridays. Monthly charts refresh on the last trading day of each month. No paywall. No sign-up required.
Built by Foliotrail.
All content on this website — including charts, analysis, price targets, support/resistance levels, and position zones — is generated entirely by AI and provided for educational and informational purposes only.
This is not financial advice. NEXUSNOIR VENTURES SL (the operator of this website) is not a registered investment adviser or broker-dealer. You should not make investment decisions based solely on this information. Always do your own research and consult a qualified financial advisor.
By continuing, you acknowledge that you have read and agree to our full disclaimer & terms of use and privacy policy.