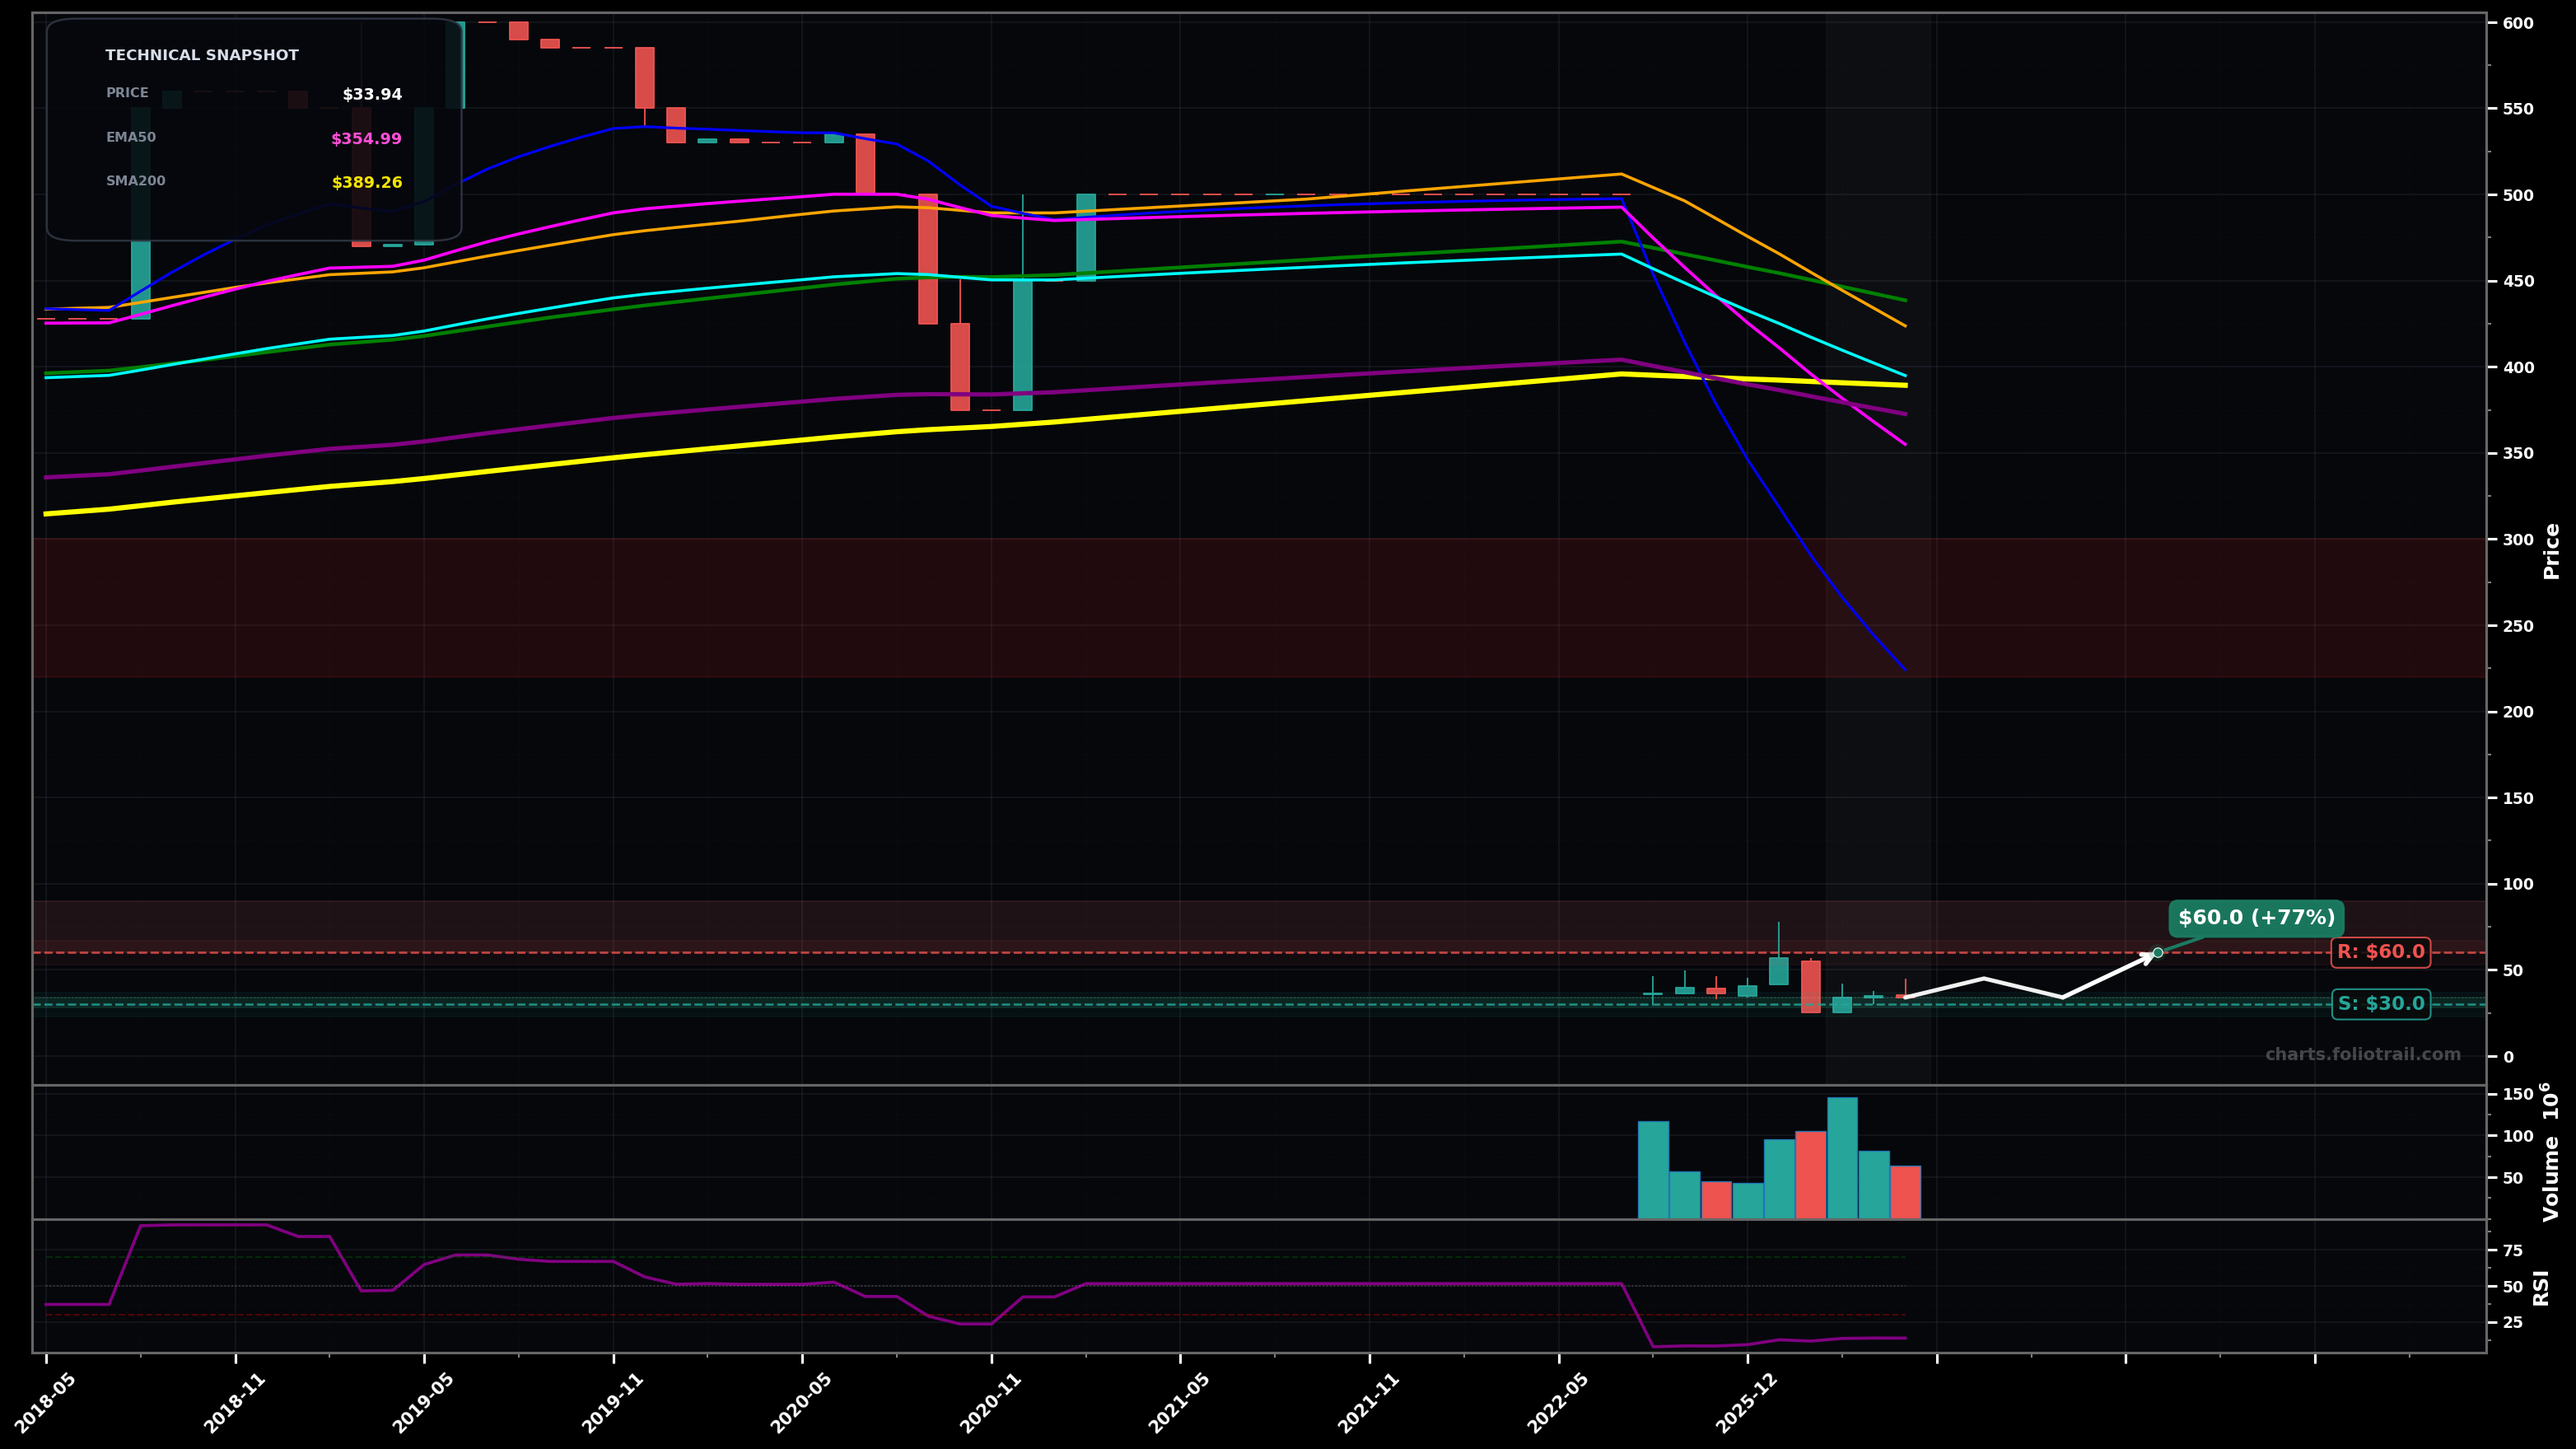
As of May 22, 2026, FIGR (Figure Technology Solutions Inc Cl A) is in a falling knife state on the monthly chart, with a confidence level of 78%. Key support is at $30.0 and key resistance at $60.0. Monthly price collapsed to ~$33.94, far below all key EMAs/SMAs; RSI-14 deeply oversold (~13.8) with small recent candles suggesting a weak pause after capitulation.
Base-building attempt: price holds the $30 area, forms a swing low, then mean-reverts into the first overhead supply zone (still a bear-market rally unless reclaimed). Prob ~60%.
Continuation leg down: $30 breaks on a monthly close, triggering another liquidation wave before any sustainable bottom forms. Prob ~40%.
Another monthly close below $30 would confirm continued falling-knife behavior
Two consecutive monthly closes back above $60 would invalidate the falling-knife label (shift toward bottoming attempt)
Staggered bids around the current swing-low area ($30) and lower Fibonacci-style extension zones; trend is down so sizing increases only if flush/undercut occurs and selling pressure exhausts.
Likely overhead supply stacks from prior breakdown zones; trimming into progressively stronger mean-reversion levels reduces risk while price remains far below long-term MAs (SMA200 ~$389, EMA200 ~$372).
As of May 22, 2026, FIGR (Figure Technology Solutions Inc Cl A) is in a falling knife state on the monthly chart with 78% confidence. Monthly price collapsed to ~$33.94, far below all key EMAs/SMAs; RSI-14 deeply oversold (~13.8) with small recent candles suggesting a weak pause after capitulation.
On the monthly timeframe, FIGR has key support at $30.0 and key resistance at $60.0. The most likely scenario (bullish) targets $45.0 and $60.0, with a revert level at $34.0.
FIGR (Figure Technology Solutions Inc Cl A) is currently classified as falling knife on the monthly chart, with 78% confidence. Confirmation requires: Another monthly close below $30 would confirm continued falling-knife behavior This would be invalidated by: Two consecutive monthly closes back above $60 would invalidate the falling-knife label (shift toward bottoming attempt)
The most likely scenario (bullish) targets $45.0 and $60.0, with a revert level at $34.0. The alternative scenario (bearish) targets $22.0 and $15.0.
Multi-layer AI agents analyse 200+ stocks across daily, weekly, and monthly timeframes — producing market state classifications, price scenarios with targets, and position entry/exit levels. Daily charts updated every trading day at 6 PM ET. Weekly charts refresh Fridays. Monthly charts refresh on the last trading day of each month. No paywall. No sign-up required.
Built by Foliotrail.
All content on this website — including charts, analysis, price targets, support/resistance levels, and position zones — is generated entirely by AI and provided for educational and informational purposes only.
This is not financial advice. NEXUSNOIR VENTURES SL (the operator of this website) is not a registered investment adviser or broker-dealer. You should not make investment decisions based solely on this information. Always do your own research and consult a qualified financial advisor.
By continuing, you acknowledge that you have read and agree to our full disclaimer & terms of use and privacy policy.