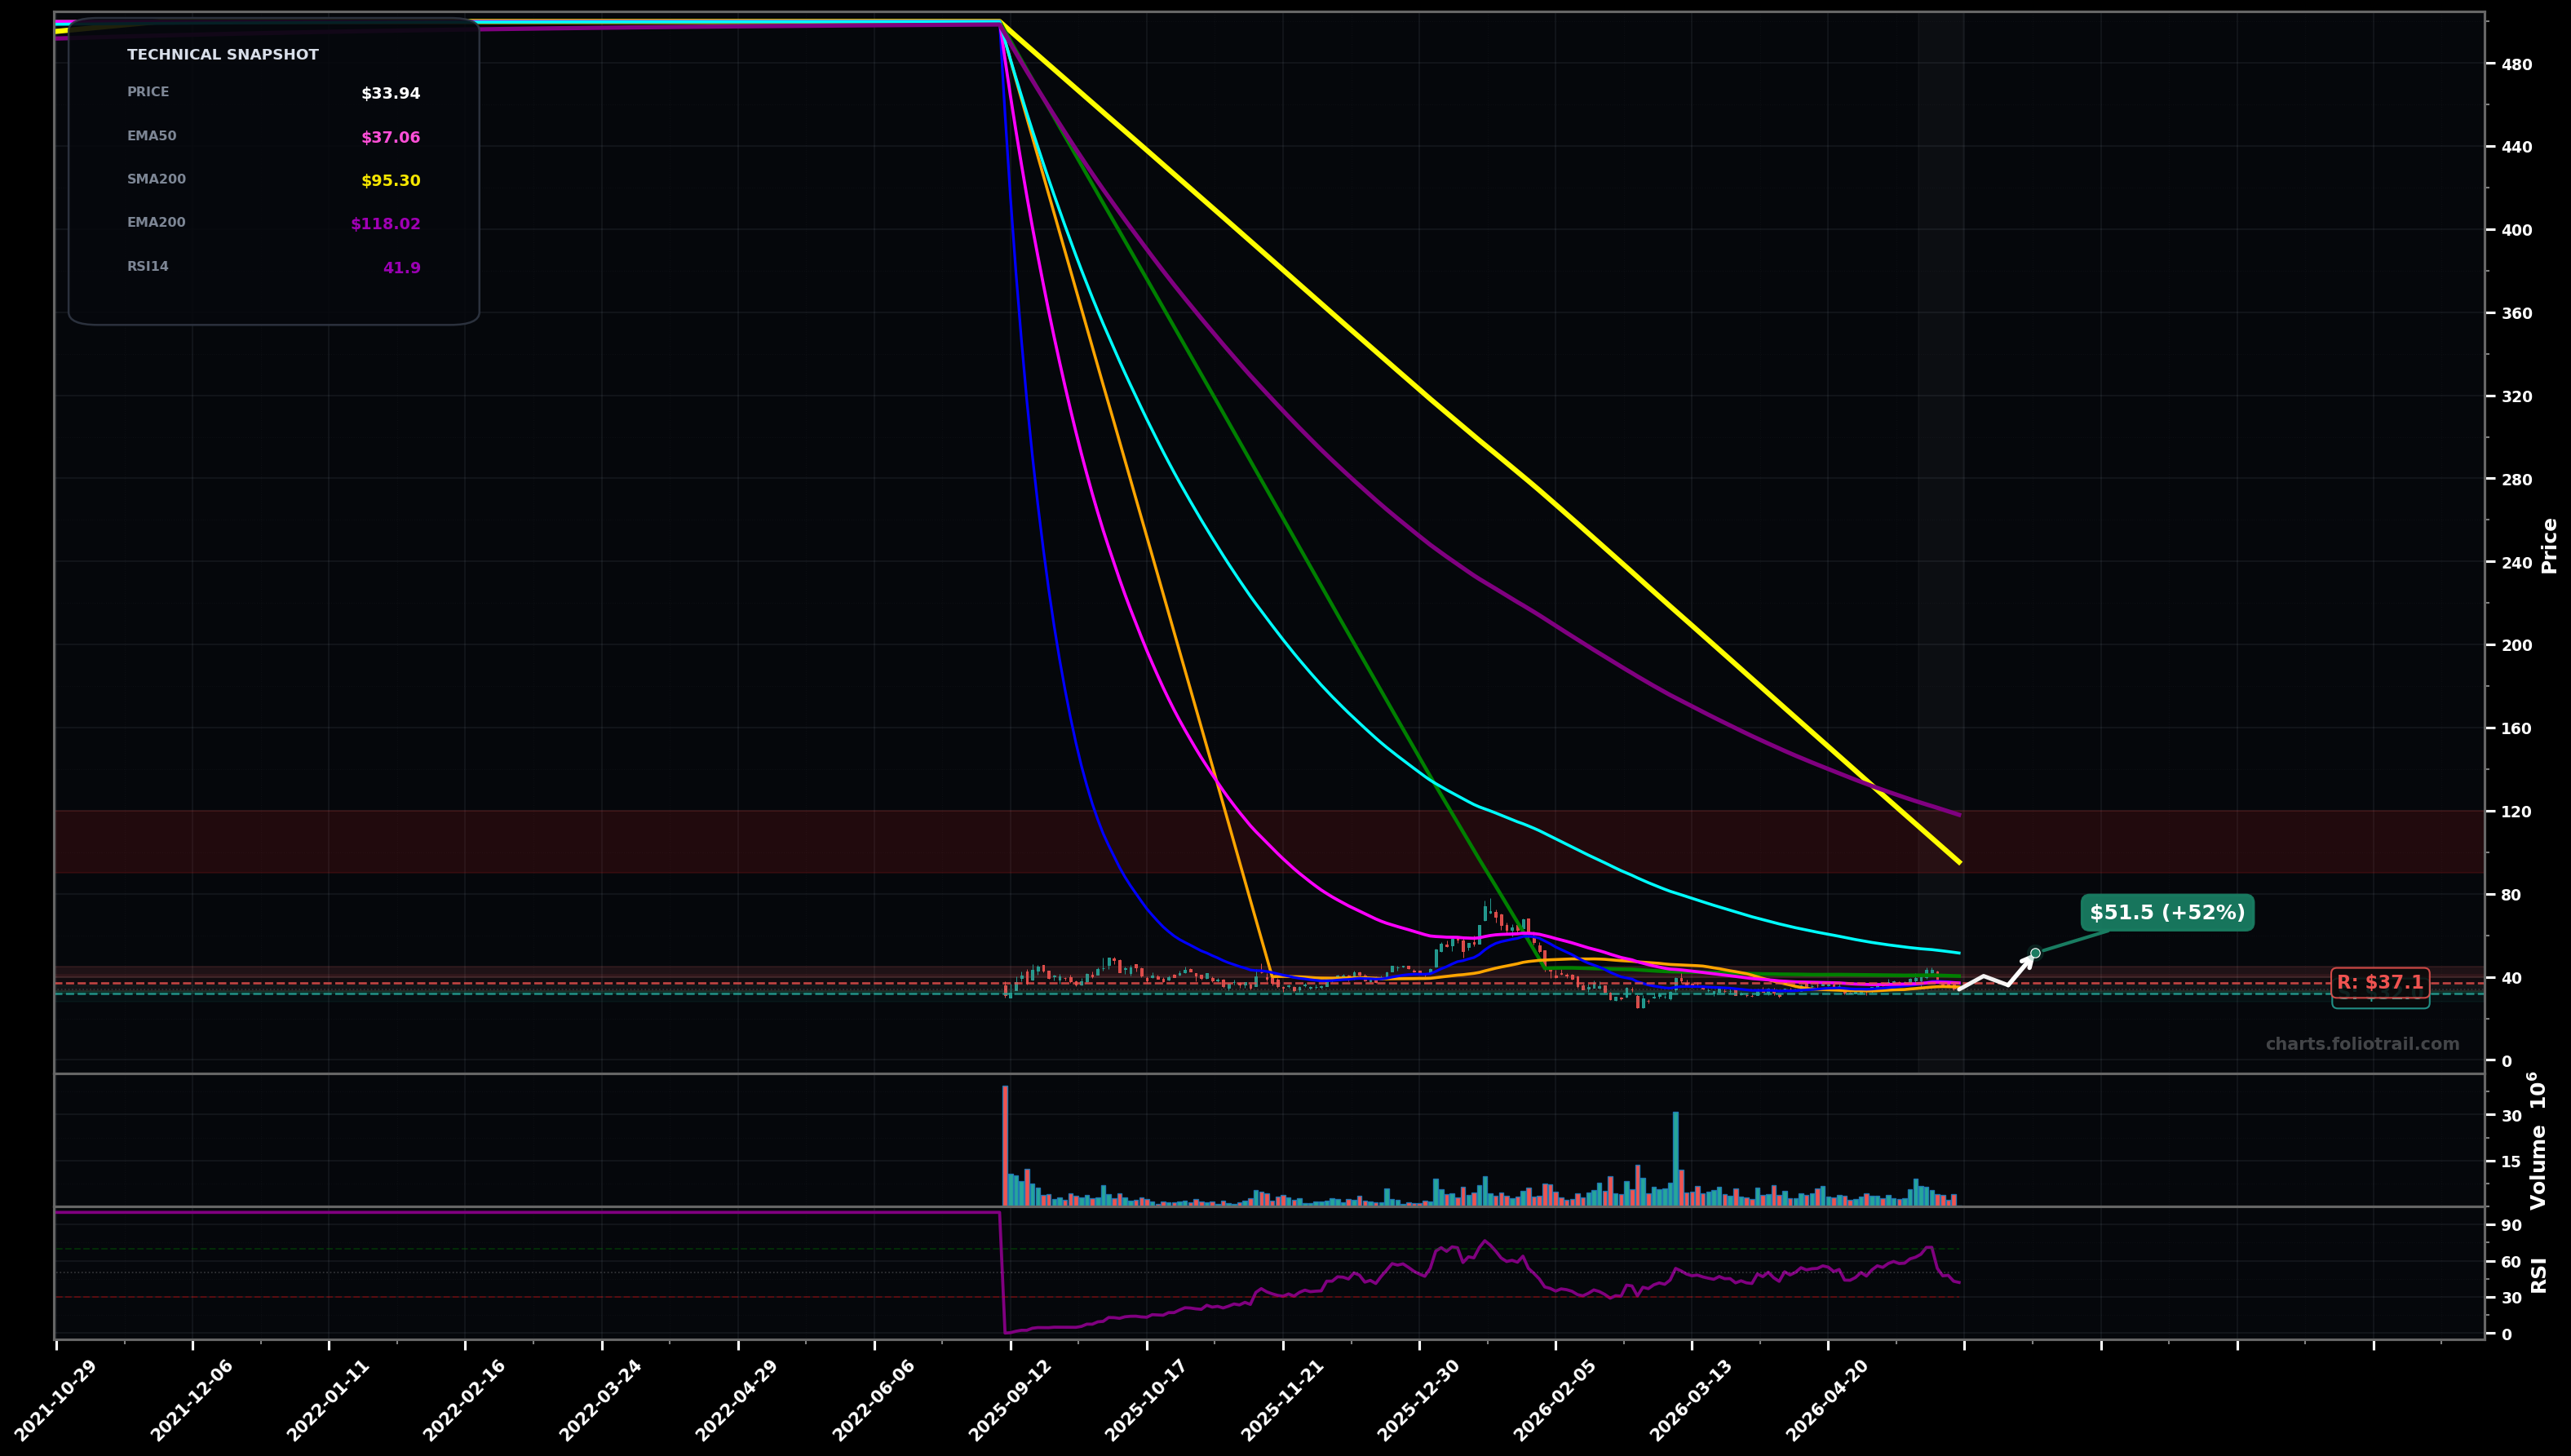
As of May 22, 2026, FIGR (Figure Technology Solutions Inc Cl A) is in a stabilized base state on the daily chart, with a confidence level of 63%. Key support is at $32.0 and key resistance at $37.1. Price ~$33.94 is basing after a long drawdown; recent candles are holding a tight range under the declining EMA50 (~$37.06) with RSI-14 ~41.9 (muted momentum).
Base holds in the $32-$37 band, then a breakout/reclaim of EMA50 triggers a squeeze toward the next MA cluster; Elliott view: building a bottoming structure (wave 1 up attempt) with a shallow wave 2 pullback likely before continuation.
Support fails and price breaks the base floor; downside continuation resumes (bear leg) and seeks lower demand before any durable reversal; Elliott view: base was a corrective pause (wave 4/ABC) before another impulse down.
Daily close > $37.10 for 2+ sessions (reclaim/hold EMA50) would confirm a base-to-breakout attempt
Daily close < $31.00 would invalidate the base and reopen downside continuation risk
Start near current base support, add on confirmed sweep/flush into prior demand, heavy-add only if capitulation drives a deeper discount while keeping risk defined below the swing-low reference.
Trim into overhead MA supply zones first (SMA100 ~$40.4 / EMA100 ~$51.5), trim more if price gets extended well above the base, and only consider full exit if a multi-year mean reversion toward the very high long MAs (SMA200/EMA200 area) occurs.
As of May 22, 2026, FIGR (Figure Technology Solutions Inc Cl A) is in a stabilized base state on the daily chart with 63% confidence. Price ~$33.94 is basing after a long drawdown; recent candles are holding a tight range under the declining EMA50 (~$37.06) with RSI-14 ~41.9 (muted momentum).
On the daily timeframe, FIGR has key support at $32.0 and key resistance at $37.1. The most likely scenario (bullish) targets $40.4 and $51.5, with a revert level at $36.0.
FIGR (Figure Technology Solutions Inc Cl A) is currently classified as stabilized base on the daily chart, with 63% confidence. Confirmation requires: Daily close > $37.10 for 2+ sessions (reclaim/hold EMA50) would confirm a base-to-breakout attempt This would be invalidated by: Daily close < $31.00 would invalidate the base and reopen downside continuation risk
The most likely scenario (bullish) targets $40.4 and $51.5, with a revert level at $36.0. The alternative scenario (bearish) targets $30.0 and $26.0.
Multi-layer AI agents analyse 200+ stocks across daily, weekly, and monthly timeframes — producing market state classifications, price scenarios with targets, and position entry/exit levels. Daily charts updated every trading day at 6 PM ET. Weekly charts refresh Fridays. Monthly charts refresh on the last trading day of each month. No paywall. No sign-up required.
Built by Foliotrail.
All content on this website — including charts, analysis, price targets, support/resistance levels, and position zones — is generated entirely by AI and provided for educational and informational purposes only.
This is not financial advice. NEXUSNOIR VENTURES SL (the operator of this website) is not a registered investment adviser or broker-dealer. You should not make investment decisions based solely on this information. Always do your own research and consult a qualified financial advisor.
By continuing, you acknowledge that you have read and agree to our full disclaimer & terms of use and privacy policy.