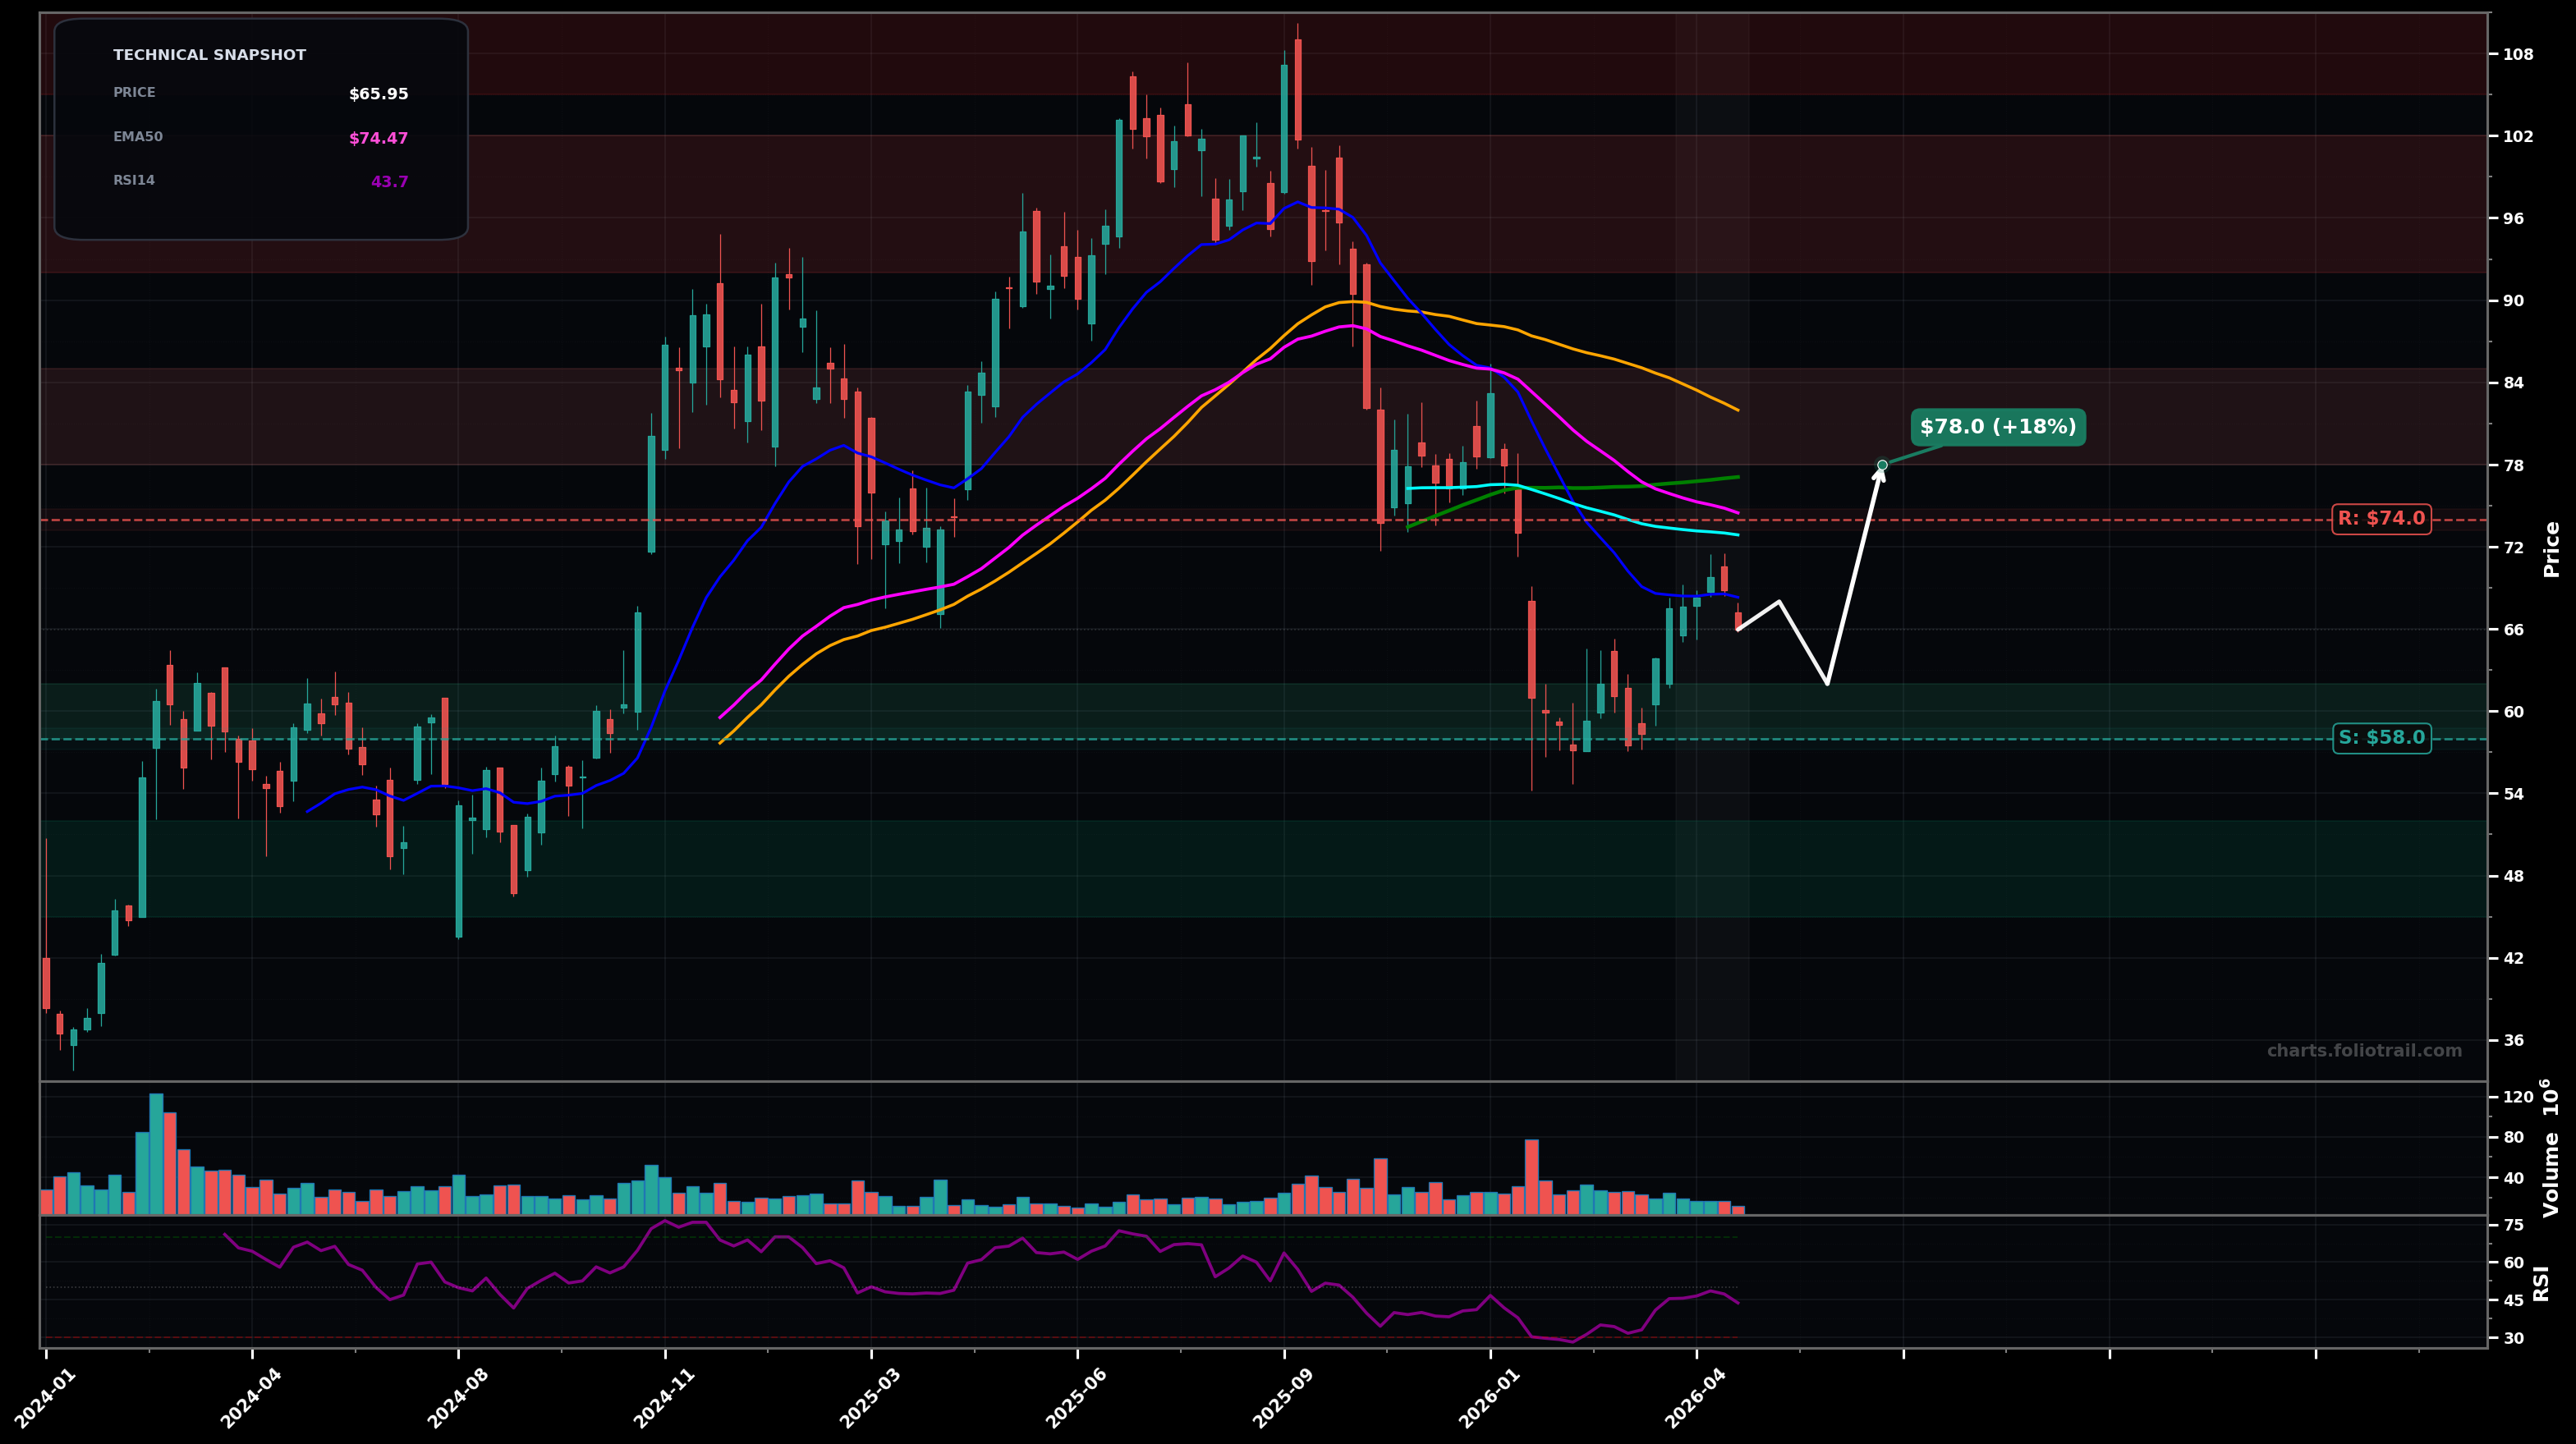
As of May 22, 2026, FBTC (Fidelity Wise Origin Bitcoin Index Fund) is in a downtrend state on the weekly chart, with a confidence level of 72%. Key support is at $58.0 and key resistance at $74.0. Weekly bounced from the ~$58 swing low into ~$66 but is stalling below the falling EMA20 (~$68) while still well under EMA50/EMA100.
Base-and-bounce inside a developing range: hold $58, grind higher to retest the EMA cluster; likely rejection first at EMA50/EMA100 then possible push to the prior breakdown shelf.
Downtrend continuation: lose the ~$58 swing low, triggering another leg down (capitulation style move) toward the next demand zone from the prior consolidation.
Weekly close below $58 confirms continued downtrend/renewed LL pressure.
Two weekly closes back above $74 (EMA50 area) would invalidate the current downtrend bias and shift toward breakout/reversal.
Entries are centered on the $58 swing-low support; adds on breakdown/retest of $58; heavy adds at the next larger demand zone ($45-$52) if the downtrend extends.
Trim into major overhead supply/mean-reversion zones: first around reclaimed breakdown shelf ($78-$85), more into prior distribution ($92-$102), and fully into the prior peak region ($105-$112).
As of May 22, 2026, FBTC (Fidelity Wise Origin Bitcoin Index Fund) is in a downtrend state on the weekly chart with 72% confidence. Weekly bounced from the ~$58 swing low into ~$66 but is stalling below the falling EMA20 (~$68) while still well under EMA50/EMA100.
On the weekly timeframe, FBTC has key support at $58.0 and key resistance at $74.0. The most likely scenario (bullish) targets $68.0 and $78.0, with a revert level at $62.0.
FBTC (Fidelity Wise Origin Bitcoin Index Fund) is currently classified as downtrend on the weekly chart, with 72% confidence. Confirmation requires: Weekly close below $58 confirms continued downtrend/renewed LL pressure. This would be invalidated by: Two weekly closes back above $74 (EMA50 area) would invalidate the current downtrend bias and shift toward breakout/reversal.
The most likely scenario (bullish) targets $68.0 and $78.0, with a revert level at $62.0. The alternative scenario (bearish) targets $52.0 and $45.0.
Multi-layer AI agents analyse 200+ stocks across daily, weekly, and monthly timeframes — producing market state classifications, price scenarios with targets, and position entry/exit levels. Daily charts updated every trading day at 6 PM ET. Weekly charts refresh Fridays. Monthly charts refresh on the last trading day of each month. No paywall. No sign-up required.
Built by Foliotrail.
All content on this website — including charts, analysis, price targets, support/resistance levels, and position zones — is generated entirely by AI and provided for educational and informational purposes only.
This is not financial advice. NEXUSNOIR VENTURES SL (the operator of this website) is not a registered investment adviser or broker-dealer. You should not make investment decisions based solely on this information. Always do your own research and consult a qualified financial advisor.
By continuing, you acknowledge that you have read and agree to our full disclaimer & terms of use and privacy policy.