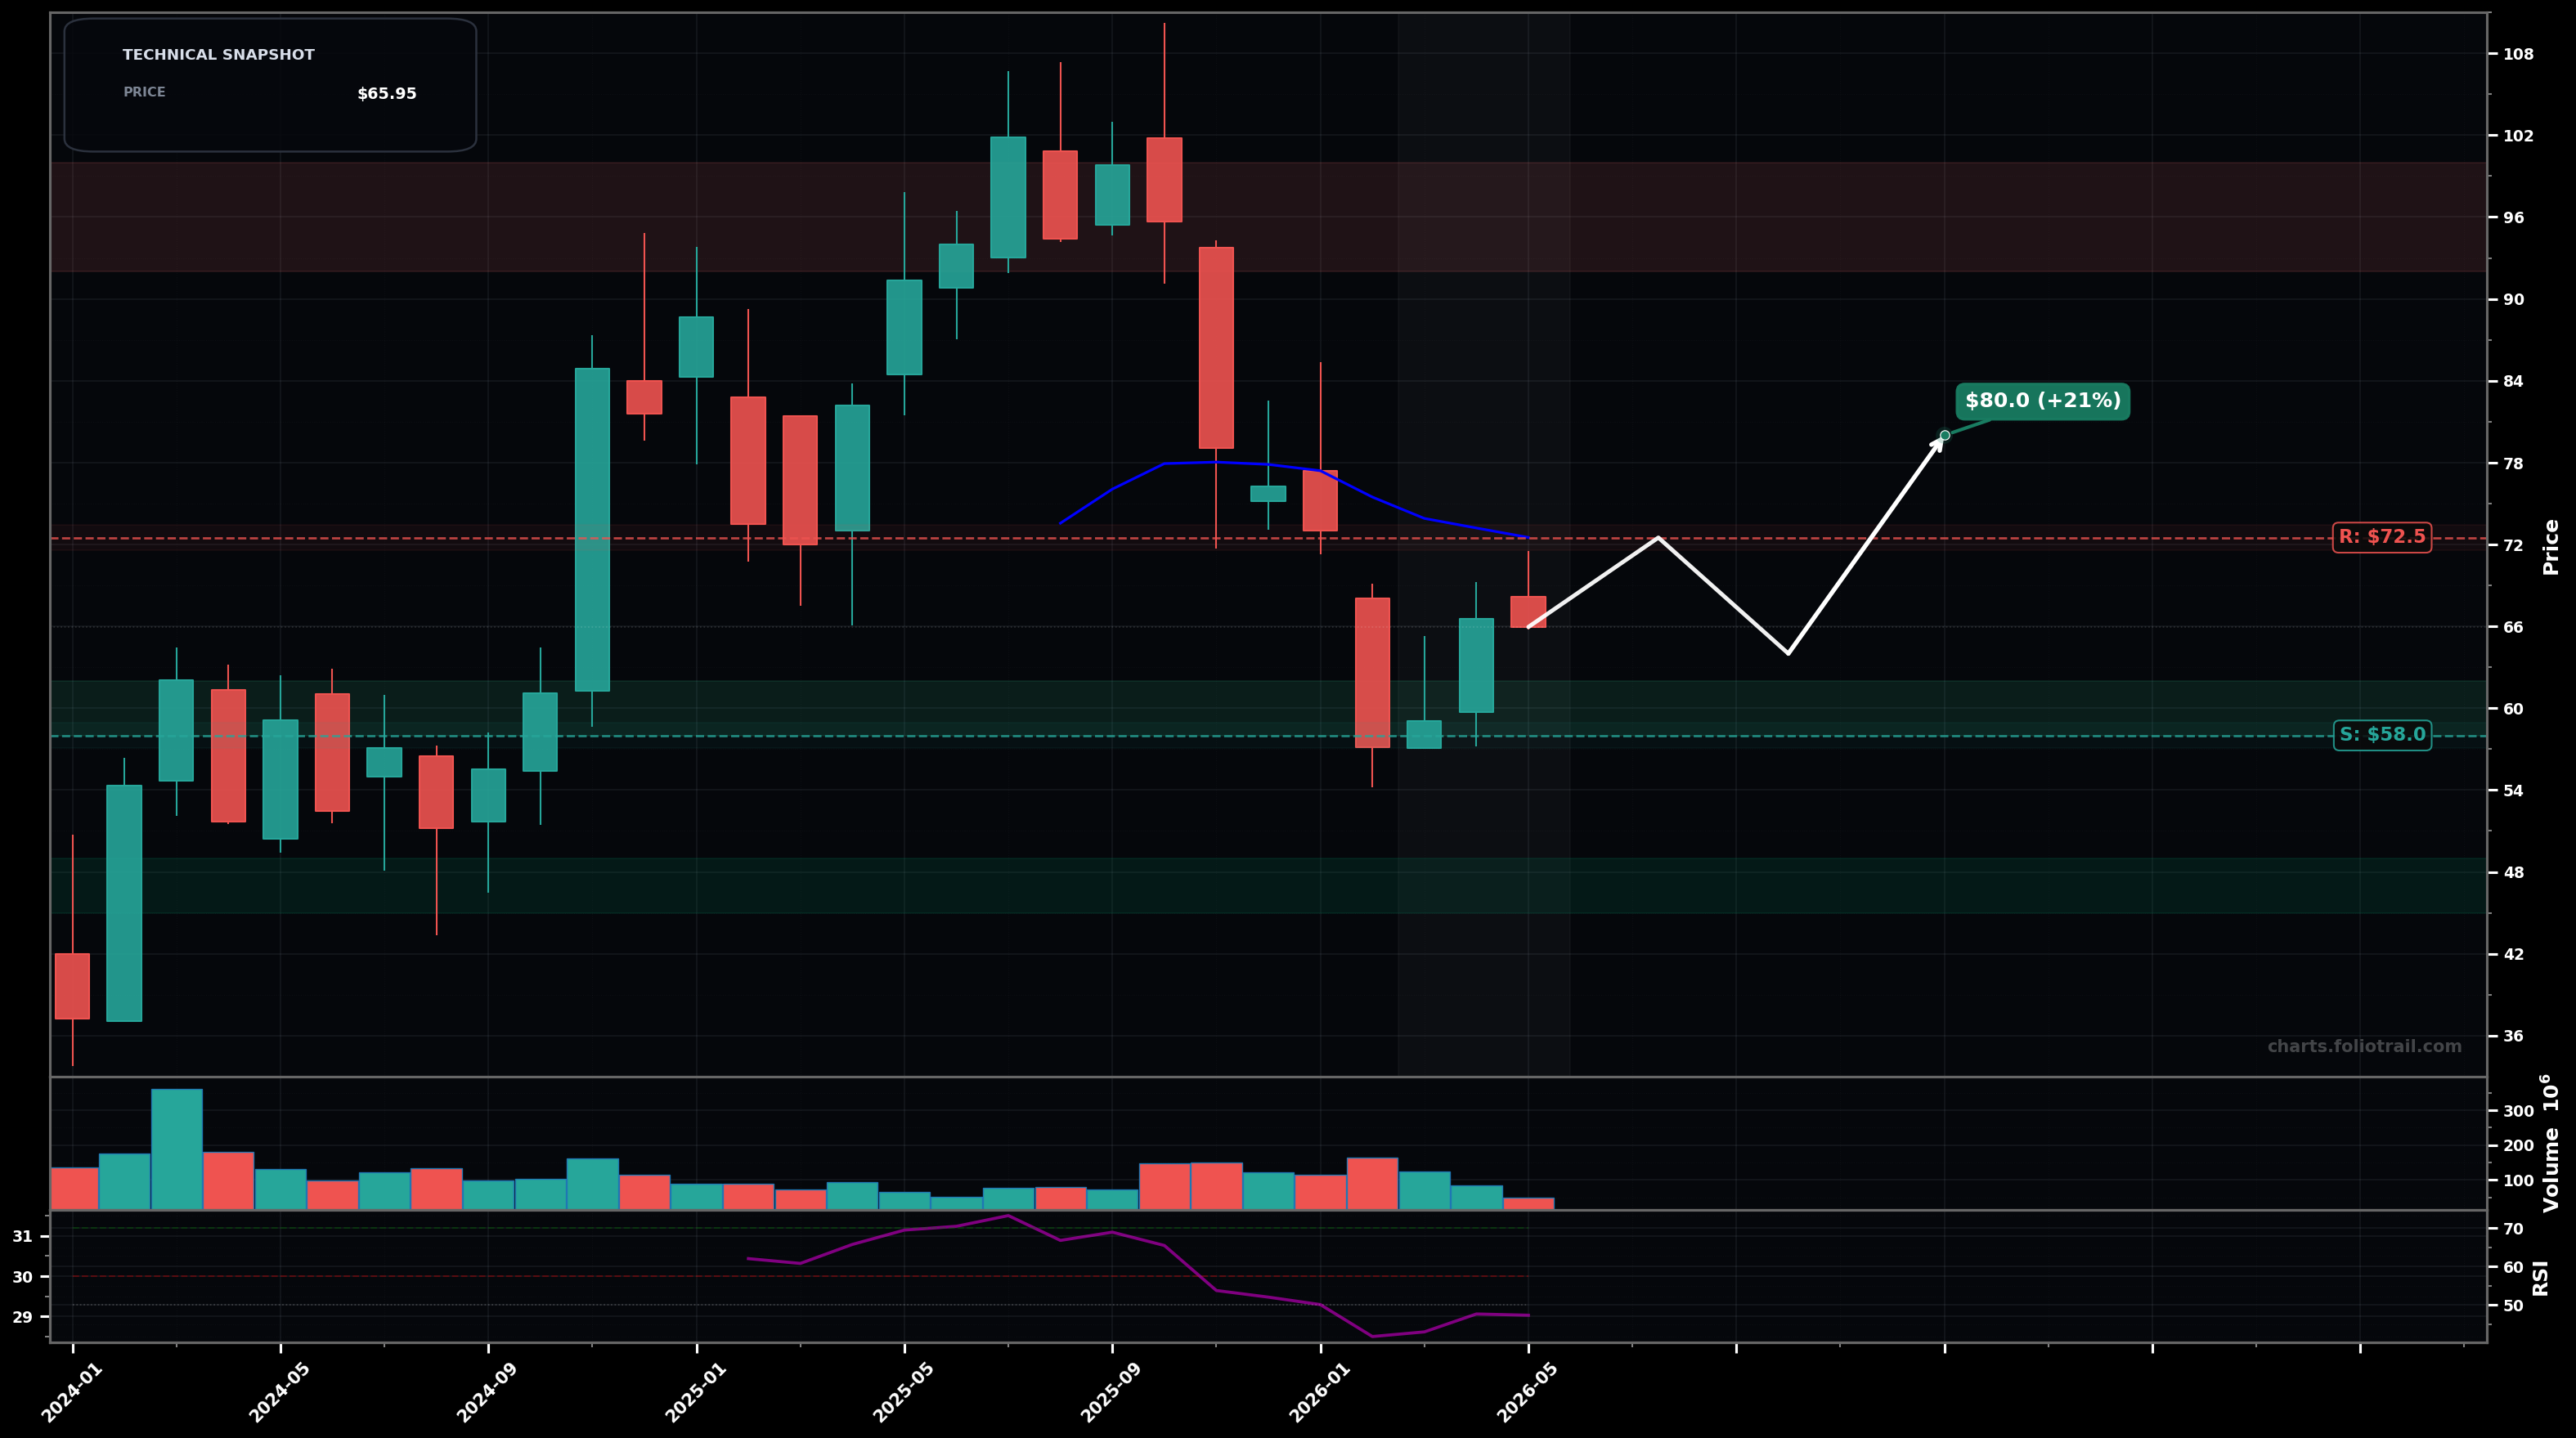
As of May 22, 2026, FBTC (Fidelity Wise Origin Bitcoin Index Fund) is in a downtrend state on the monthly chart, with a confidence level of 67%. Key support is at $58.0 and key resistance at $72.5. Monthly pullback from the ~$100+ peak has produced a LH sequence and price is below the fast trend line (EMA20 shown), with a small bounce attempt around mid-$60s.
Base-then-bounce: price holds $58 support (swing low/high reference area) and works back into a mean-reversion rally toward the EMA20 zone; rejection near $72.5 can still keep it range-bound before any larger decision.
Trend continuation: failure to hold the $58 swing-low support triggers another leg down (Elliott-style wave C/5 extension), with sellers pressing toward the prior consolidation region in the low-$50s and then mid-$40s.
Confirm downtrend continuation on a monthly close below $58.00
Invalidate (trend shift/breakout reversal risk) on 2 monthly closes above $72.50
Scale-in is anchored to the current swing-low support (~$58), then prior demand/50% retrace area (low-$50s), then deeper capitulation zone (mid-$40s) if the monthly support breaks.
Trim into prior peak supply ($92–$100) and the ATH/extension zone ($102+); full exit reserved for a clear multi-year extension/overstretch above the prior highs (>$115).
As of May 22, 2026, FBTC (Fidelity Wise Origin Bitcoin Index Fund) is in a downtrend state on the monthly chart with 67% confidence. Monthly pullback from the ~$100+ peak has produced a LH sequence and price is below the fast trend line (EMA20 shown), with a small bounce attempt around mid-$60s.
On the monthly timeframe, FBTC has key support at $58.0 and key resistance at $72.5. The most likely scenario (bullish) targets $72.5 and $80.0, with a revert level at $64.0.
FBTC (Fidelity Wise Origin Bitcoin Index Fund) is currently classified as downtrend on the monthly chart, with 67% confidence. Confirmation requires: Confirm downtrend continuation on a monthly close below $58.00 This would be invalidated by: Invalidate (trend shift/breakout reversal risk) on 2 monthly closes above $72.50
The most likely scenario (bullish) targets $72.5 and $80.0, with a revert level at $64.0. The alternative scenario (bearish) targets $52.0 and $45.0.
Multi-layer AI agents analyse 200+ stocks across daily, weekly, and monthly timeframes — producing market state classifications, price scenarios with targets, and position entry/exit levels. Daily charts updated every trading day at 6 PM ET. Weekly charts refresh Fridays. Monthly charts refresh on the last trading day of each month. No paywall. No sign-up required.
Built by Foliotrail.
All content on this website — including charts, analysis, price targets, support/resistance levels, and position zones — is generated entirely by AI and provided for educational and informational purposes only.
This is not financial advice. NEXUSNOIR VENTURES SL (the operator of this website) is not a registered investment adviser or broker-dealer. You should not make investment decisions based solely on this information. Always do your own research and consult a qualified financial advisor.
By continuing, you acknowledge that you have read and agree to our full disclaimer & terms of use and privacy policy.