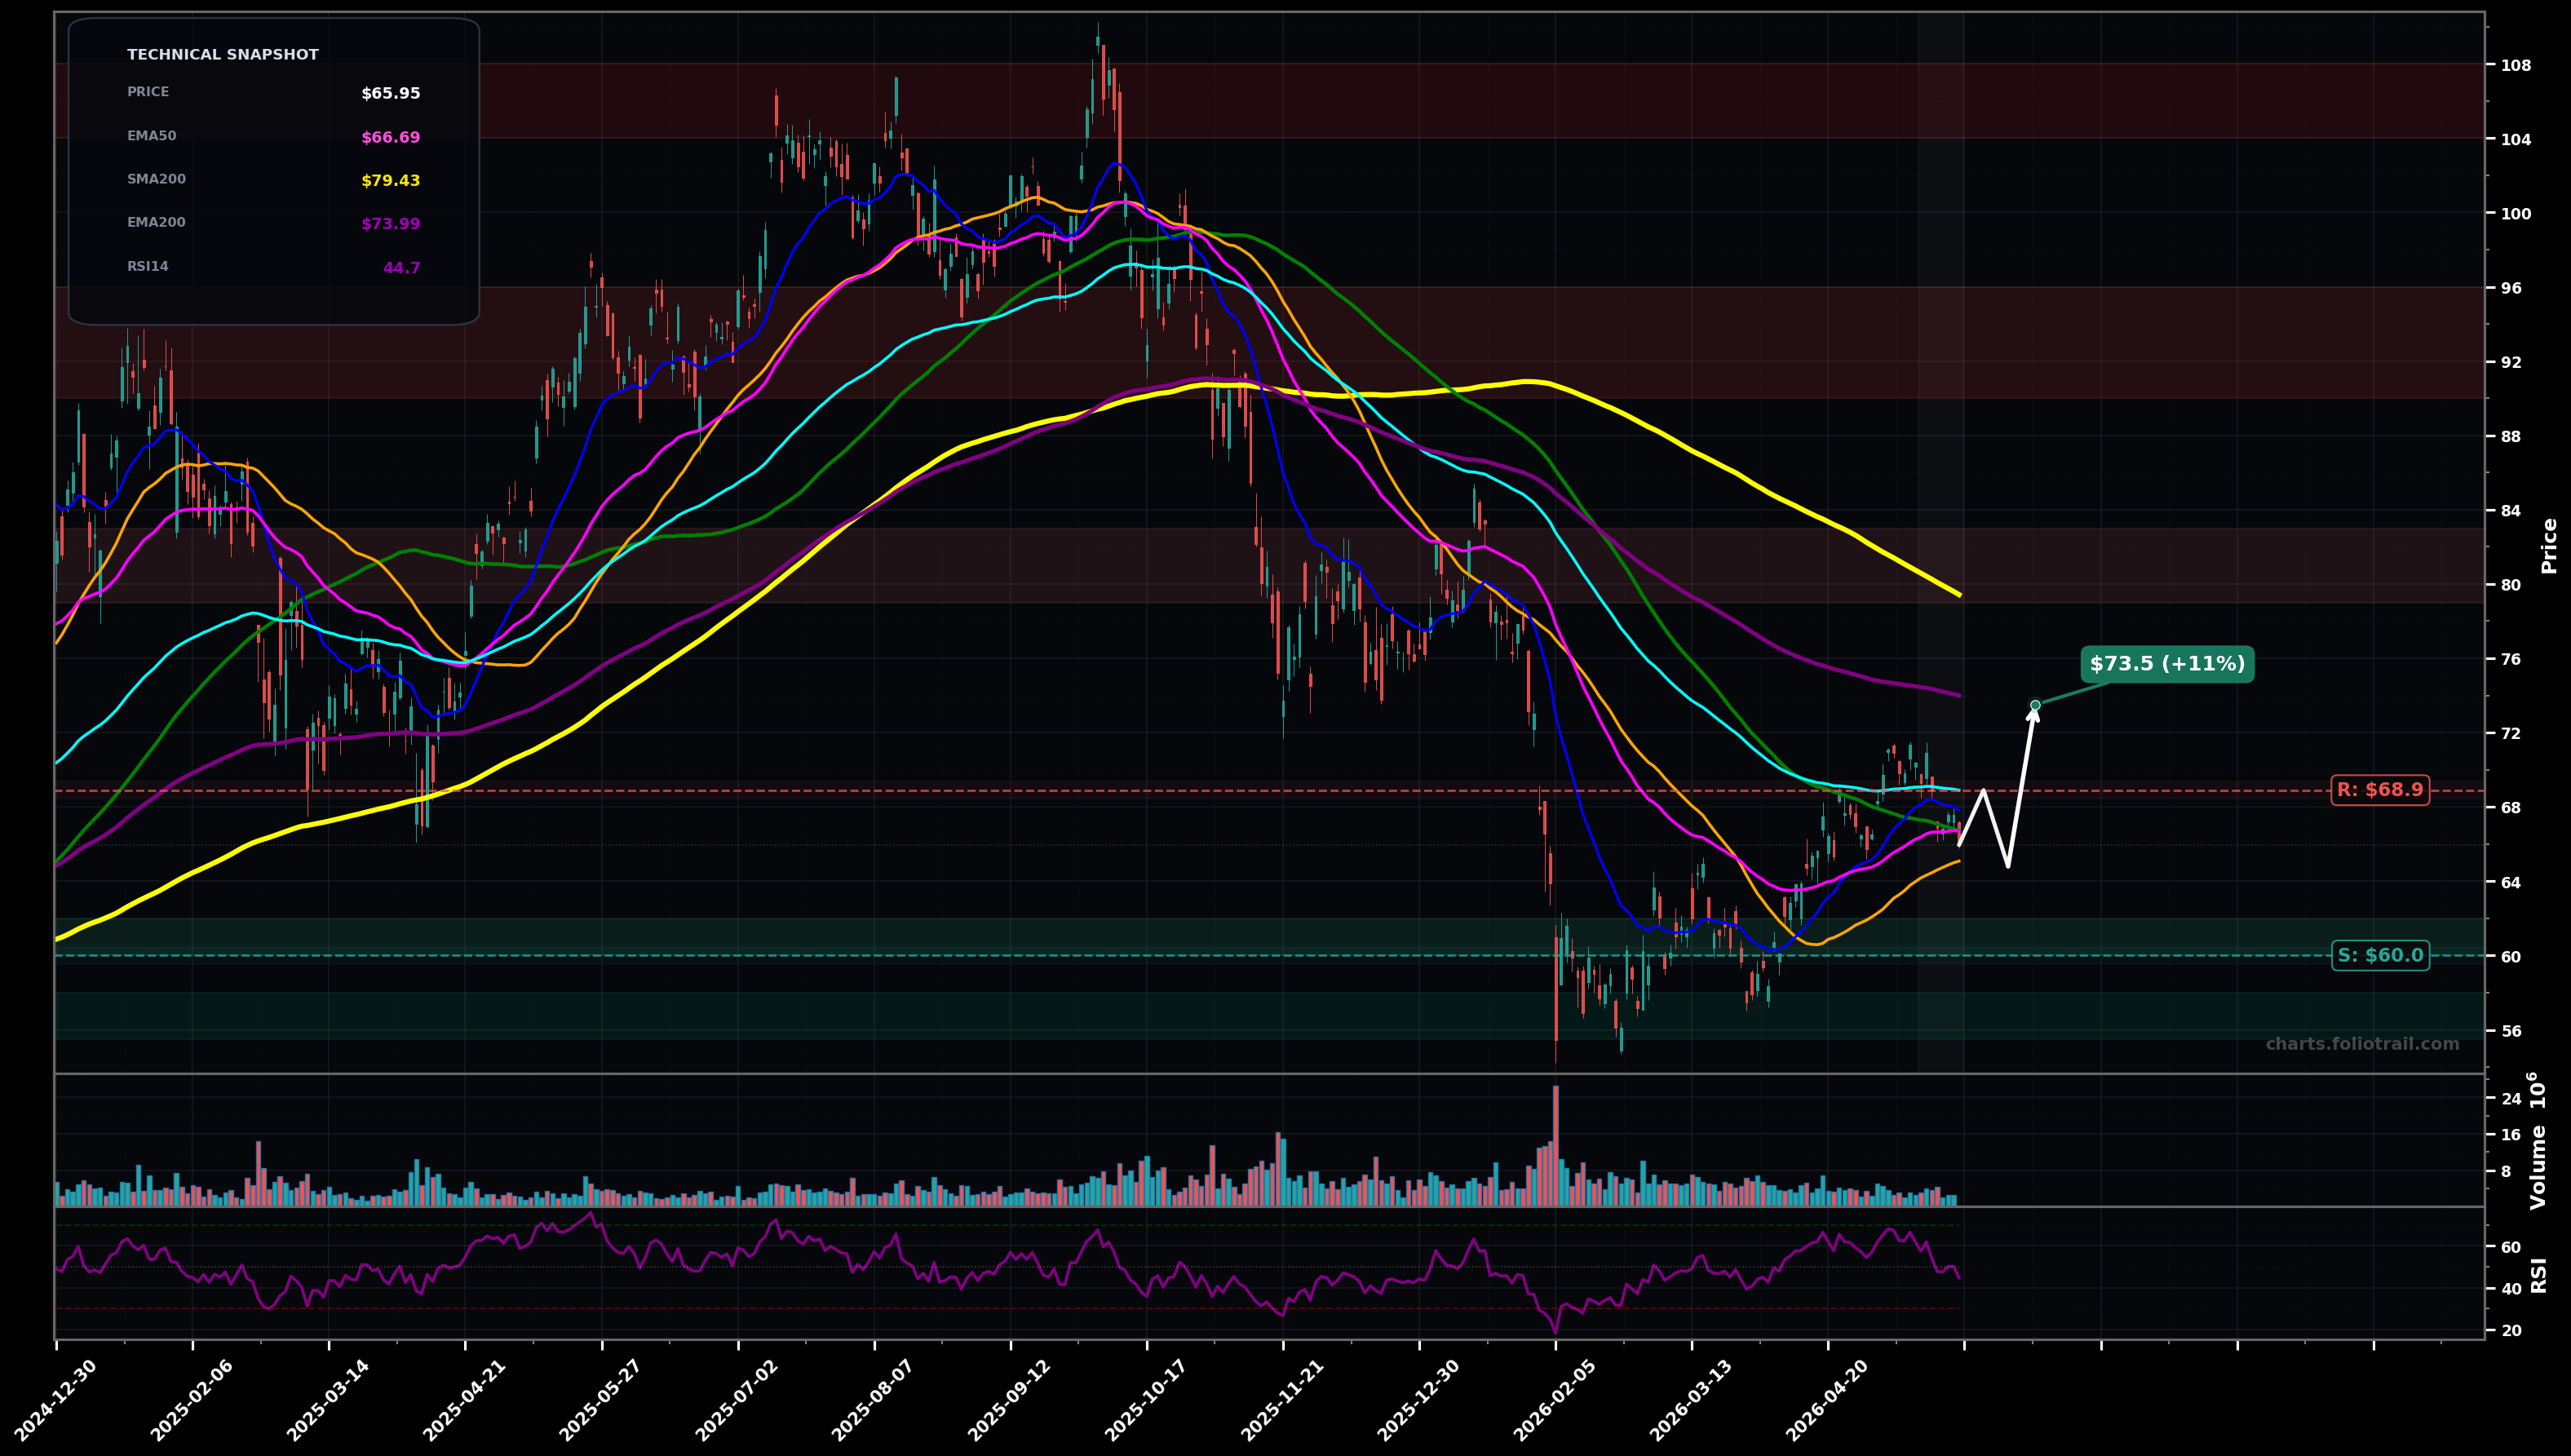
As of May 22, 2026, FBTC (Fidelity Wise Origin Bitcoin Index Fund) is in a bottoming attempt state on the daily chart, with a confidence level of 58%. Key support is at $60.0 and key resistance at $68.9. Price near $65.95 is stalling after a rebound from the ~$56–$58 capitulation low; currently below the falling EMA50/EMA100 and under the $66–$69 MA cluster with RSI(14) ~44.7 (weak momentum).
Base holds $60 and price grinds up into the MA resistance band (EMA50/EMA100 + prior breakdown area); a pullback/retest then attempts a higher high toward the falling SMA100.
Rejection at the $66–$69 MA cluster leads to another leg down, retesting the base and possibly the capitulation low if sellers regain control (bear flag risk under falling EMAs).
2+ daily closes above $68.90 (EMA100) while holding above $66.70 (EMA50) on any pullback
Daily close below $58.00 (break of the base low area)
Buy-the-base logic: $60 is the most defended round-number support; $58–$56 is the capitulation/pivot low zone—ideal only if it holds and prints stabilization (avoid if slicing through).
Trim into major overhead supply: SMA200 region (~$79) first, then the prior breakdown band near $90–$96, and fully exit near the prior cycle high supply ~$104–$108 if reached.
As of May 22, 2026, FBTC (Fidelity Wise Origin Bitcoin Index Fund) is in a bottoming attempt state on the daily chart with 58% confidence. Price near $65.95 is stalling after a rebound from the ~$56–$58 capitulation low; currently below the falling EMA50/EMA100 and under the $66–$69 MA cluster with RSI(14) ~44.7 (weak momentum).
On the daily timeframe, FBTC has key support at $60.0 and key resistance at $68.9. The most likely scenario (bullish) targets $68.9 and $73.5, with a revert level at $64.8.
FBTC (Fidelity Wise Origin Bitcoin Index Fund) is currently classified as bottoming attempt on the daily chart, with 58% confidence. Confirmation requires: 2+ daily closes above $68.90 (EMA100) while holding above $66.70 (EMA50) on any pullback This would be invalidated by: Daily close below $58.00 (break of the base low area)
The most likely scenario (bullish) targets $68.9 and $73.5, with a revert level at $64.8. The alternative scenario (bearish) targets $60.0 and $56.0.
Multi-layer AI agents analyse 200+ stocks across daily, weekly, and monthly timeframes — producing market state classifications, price scenarios with targets, and position entry/exit levels. Daily charts updated every trading day at 6 PM ET. Weekly charts refresh Fridays. Monthly charts refresh on the last trading day of each month. No paywall. No sign-up required.
Built by Foliotrail.
All content on this website — including charts, analysis, price targets, support/resistance levels, and position zones — is generated entirely by AI and provided for educational and informational purposes only.
This is not financial advice. NEXUSNOIR VENTURES SL (the operator of this website) is not a registered investment adviser or broker-dealer. You should not make investment decisions based solely on this information. Always do your own research and consult a qualified financial advisor.
By continuing, you acknowledge that you have read and agree to our full disclaimer & terms of use and privacy policy.