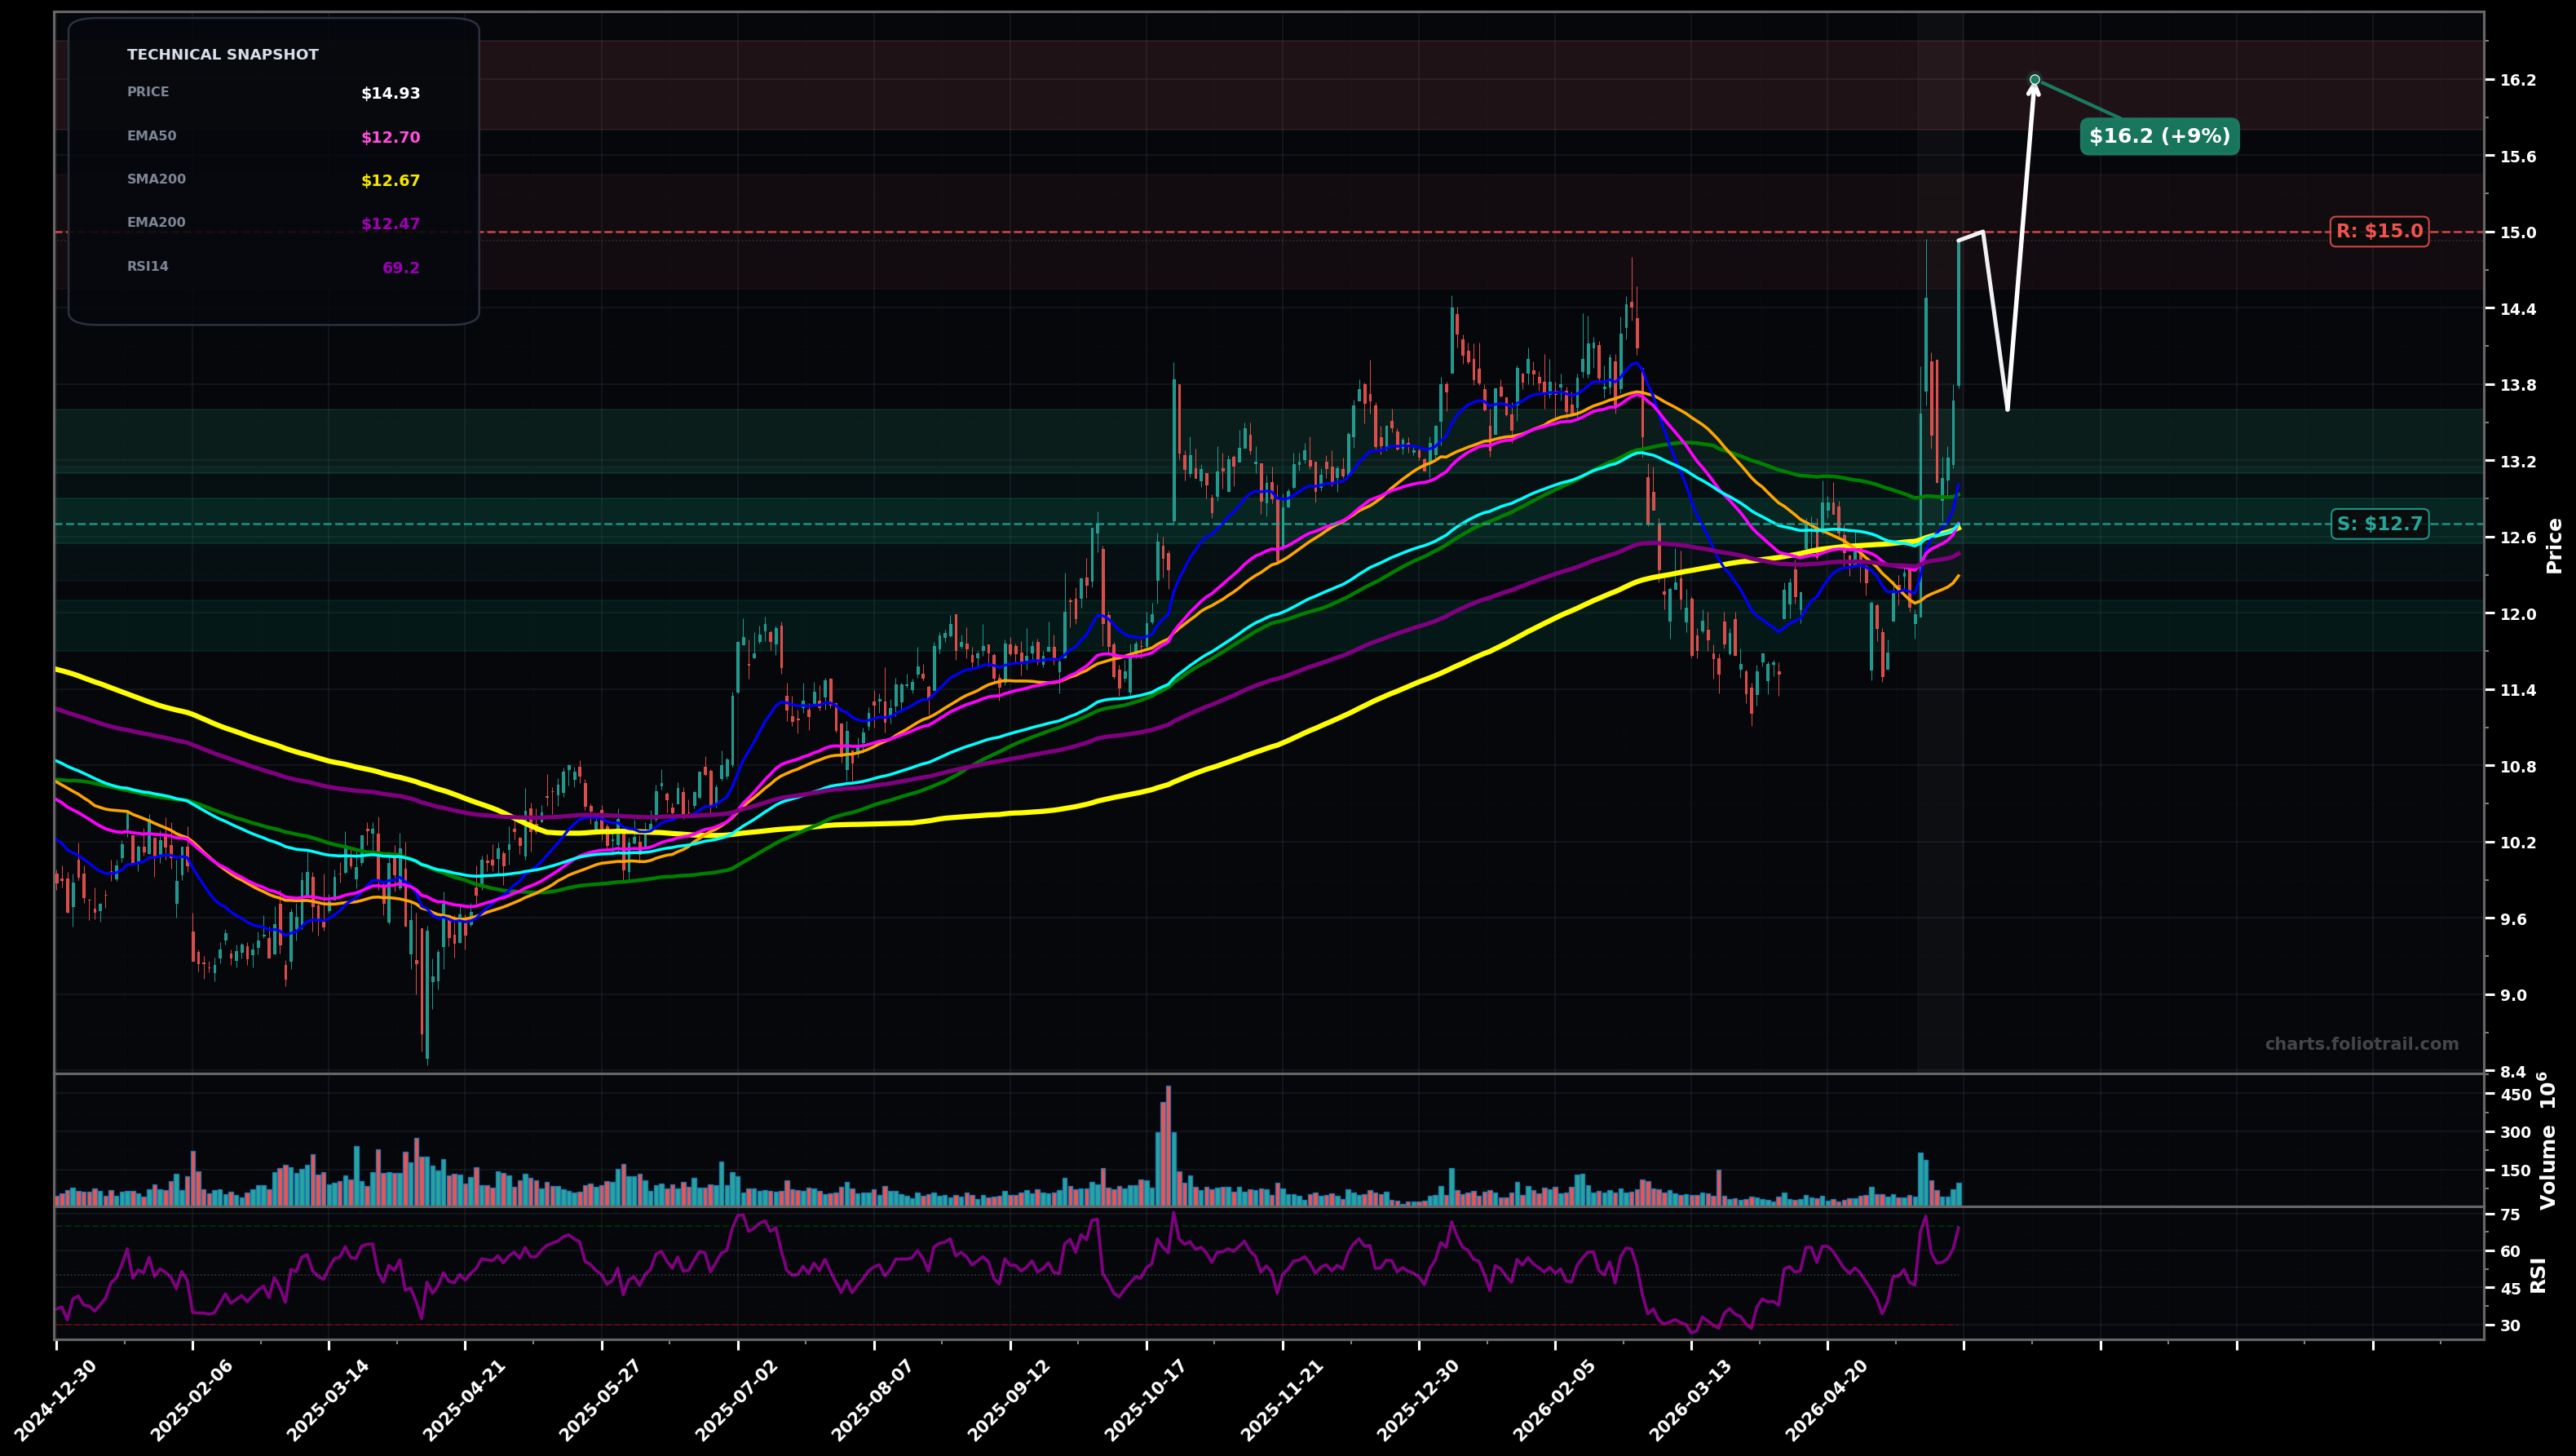
As of May 22, 2026, F (Ford Motor Company) is in a breakout reversal state on the daily chart, with a confidence level of 66%. Key support is at $12.7 and key resistance at $15.0. Sharp rebound from the $11s with a high-volume breakout back above the clustered EMA50/EMA100 and SMAs; price pushing into prior supply near the $15 area; RSI elevated (~69).
Bullish continuation: price consolidates above the reclaimed MA cluster, then grinds/impulses into the prior highs; Elliott view: likely Wave (3) / Wave C continuation after a Wave (2) pullback into the $11s; Fib projection from the $11.30 swing low to ~$14.60 swing high suggests extension room if $15 breaks.
Failed breakout / bull trap: rejection at ~$15 leads to a deeper mean-reversion back to the MA cluster; Elliott view: current spike could be Wave B (or Wave (1)) that retraces toward 0.5–0.618 of the latest impulse before deciding trend.
Daily close above $15.00 with follow-through (hold above $15 on the next close)
Daily close back below $12.50 (loss of EMA200/MA cluster support)
Start on pullbacks toward the breakout base; add at the EMA50/100+SMA100/200 confluence (~$12.6–$12.9); heavy add only near the prior swing support/undercut zone in the low $12s/$11s if the breakout retests.
Trim into extension beyond the prior high ($15 area) as RSI/price stretch increases; larger trims on Fib extensions and round-number supply; full exit only if a multi-year overextension zone is reached while momentum looks climax-like.
As of May 22, 2026, F (Ford Motor Company) is in a breakout reversal state on the daily chart with 66% confidence. Sharp rebound from the $11s with a high-volume breakout back above the clustered EMA50/EMA100 and SMAs; price pushing into prior supply near the $15 area; RSI elevated (~69).
On the daily timeframe, F has key support at $12.7 and key resistance at $15.0. The most likely scenario (bullish) targets $15.0 and $16.2, with a revert level at $13.6.
F (Ford Motor Company) is currently classified as breakout reversal on the daily chart, with 66% confidence. Confirmation requires: Daily close above $15.00 with follow-through (hold above $15 on the next close) This would be invalidated by: Daily close back below $12.50 (loss of EMA200/MA cluster support)
The most likely scenario (bullish) targets $15.0 and $16.2, with a revert level at $13.6. The alternative scenario (bearish) targets $13.0 and $12.3.
Multi-layer AI agents analyse 200+ stocks across daily, weekly, and monthly timeframes — producing market state classifications, price scenarios with targets, and position entry/exit levels. Daily charts updated every trading day at 6 PM ET. Weekly charts refresh Fridays. Monthly charts refresh on the last trading day of each month. No paywall. No sign-up required.
Built by Foliotrail.
All content on this website — including charts, analysis, price targets, support/resistance levels, and position zones — is generated entirely by AI and provided for educational and informational purposes only.
This is not financial advice. NEXUSNOIR VENTURES SL (the operator of this website) is not a registered investment adviser or broker-dealer. You should not make investment decisions based solely on this information. Always do your own research and consult a qualified financial advisor.
By continuing, you acknowledge that you have read and agree to our full disclaimer & terms of use and privacy policy.